
This is our sixth report on internet network integrity around the U.S. We have been tracking the top 200 cities in the nation by population in an effort to better understand how networks are performing amid the coronavirus pandemic.
In last week’s report, we found that the speed gains recorded over the two weeks prior had begun to slow in many cases. This week, the trend of network speeds recovering resumes, with both rural and urban areas seeing broad upticks in both upload and download performance. Here is what the data tells us.
KEY FINDINGS
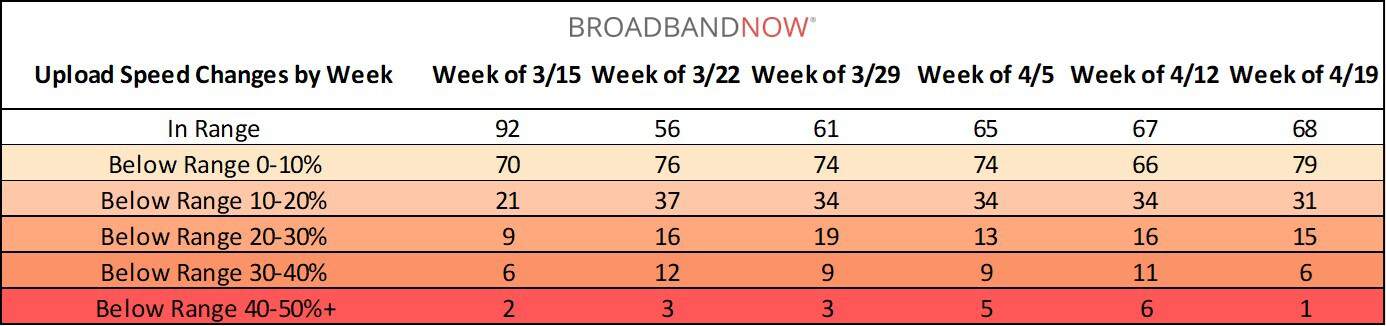
- 53 cities (26.5% of the top 200) recorded median upload speed decreases of 10% or greater this week compared to prior weeks in 2020, down from last week’s 67, or 33.5%.
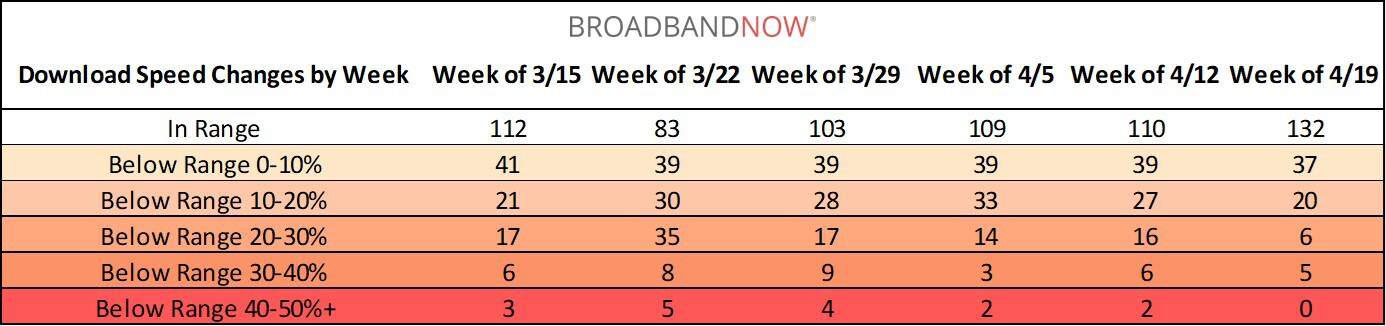
- For download speeds, 31 cities (15.5%) are now reporting median speeds 10% or greater below range, compared to last week’s 51 (25.5%).
- Median speeds in rural communities across the U.S. have begun to improve slightly in both the upload and download categories.
- Only one city experienced upload speeds that fell greater than 40% out of range this week; New Orleans. Last week, five other cities also fell into this category.
- No cities in the U.S. experienced median download speeds 40% or greater out of range this week, for the first time since we began tracking speeds in the top 200 cities by population six weeks ago.
RURAL UPDATES
Speed tests in rural communities have seen a slight uptick over the past week, with both average upload and download speeds increasing slightly. The line chart below illustrates average speeds over the past 16 calendar weeks:
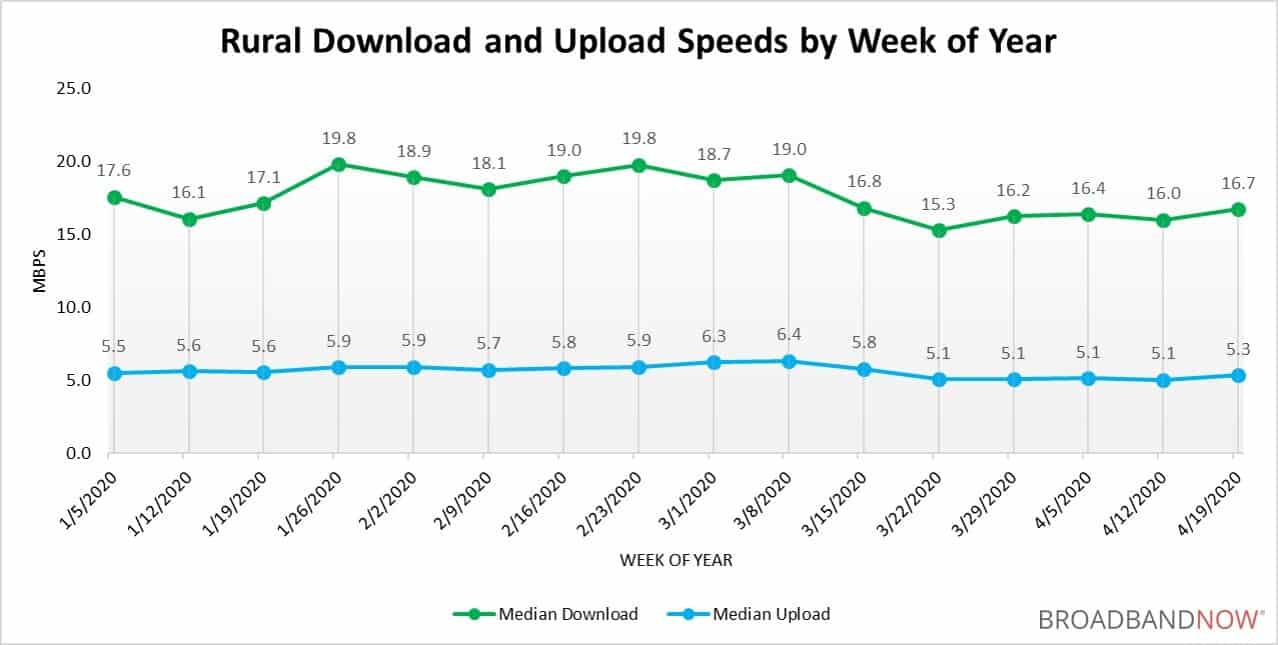
The data above is collected from aggregated speed test information taken from zip codes in counties marked as non-metropolitan (Micropolitan and Noncore) under the CDC’s Urban–Rural Classification Scheme. Results are displayed in aggregate due to the limited availability of speed test data in rural areas.
MEDIAN INTERNET SPEEDS – 200 MOST POPULOUS U.S. CITIES
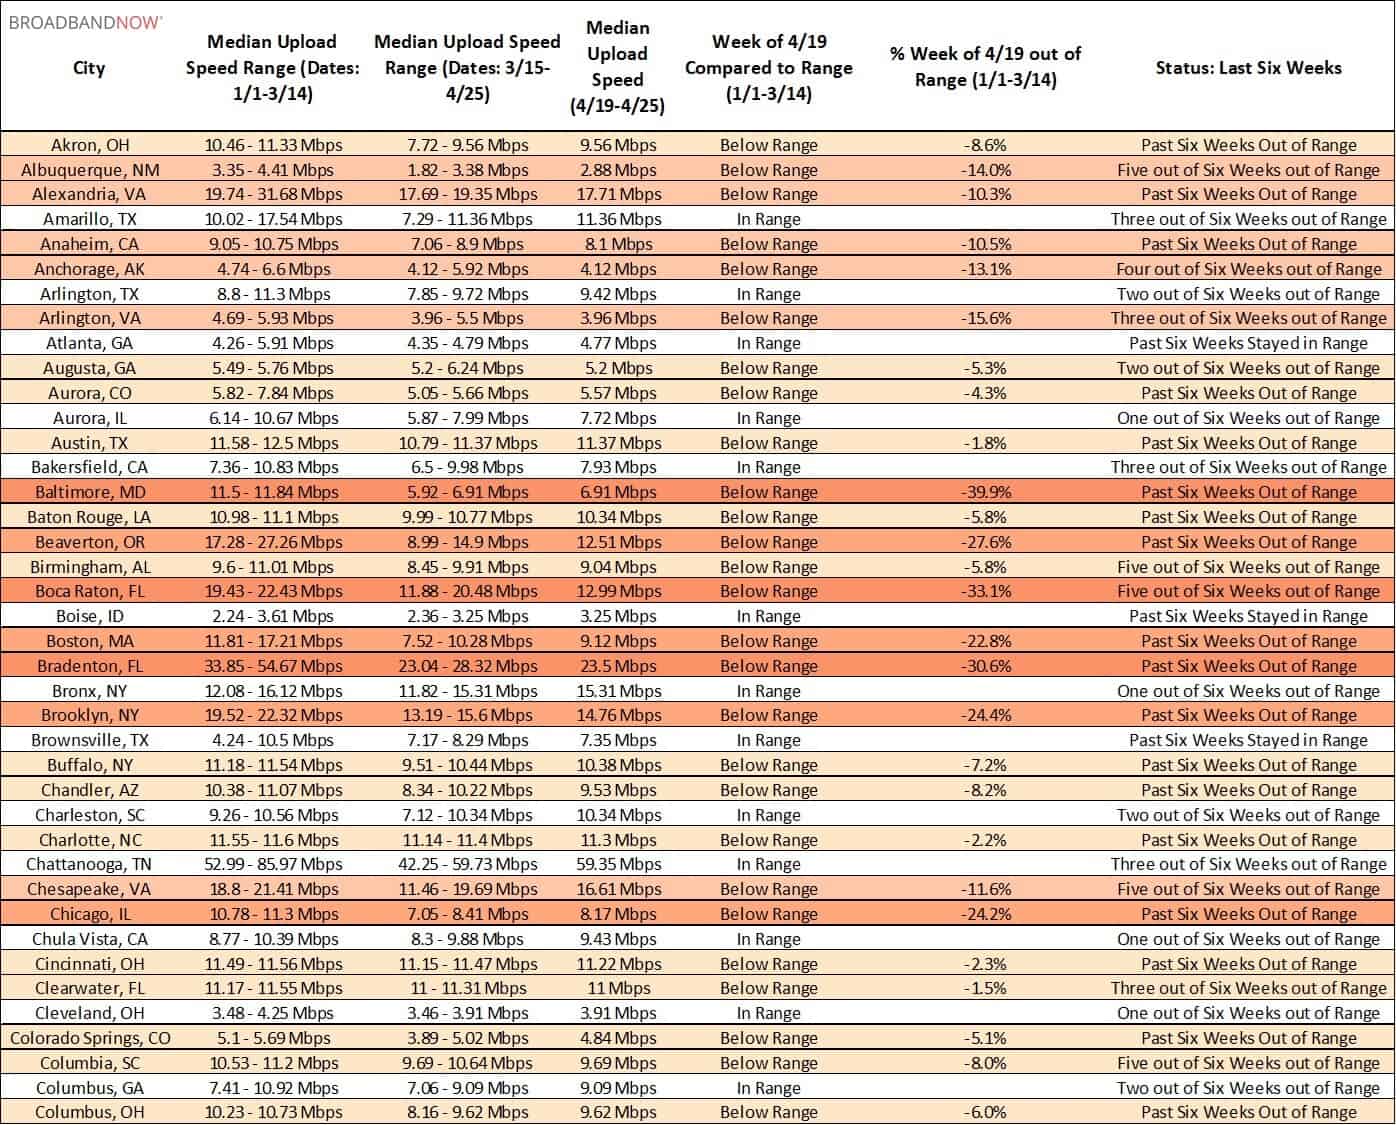
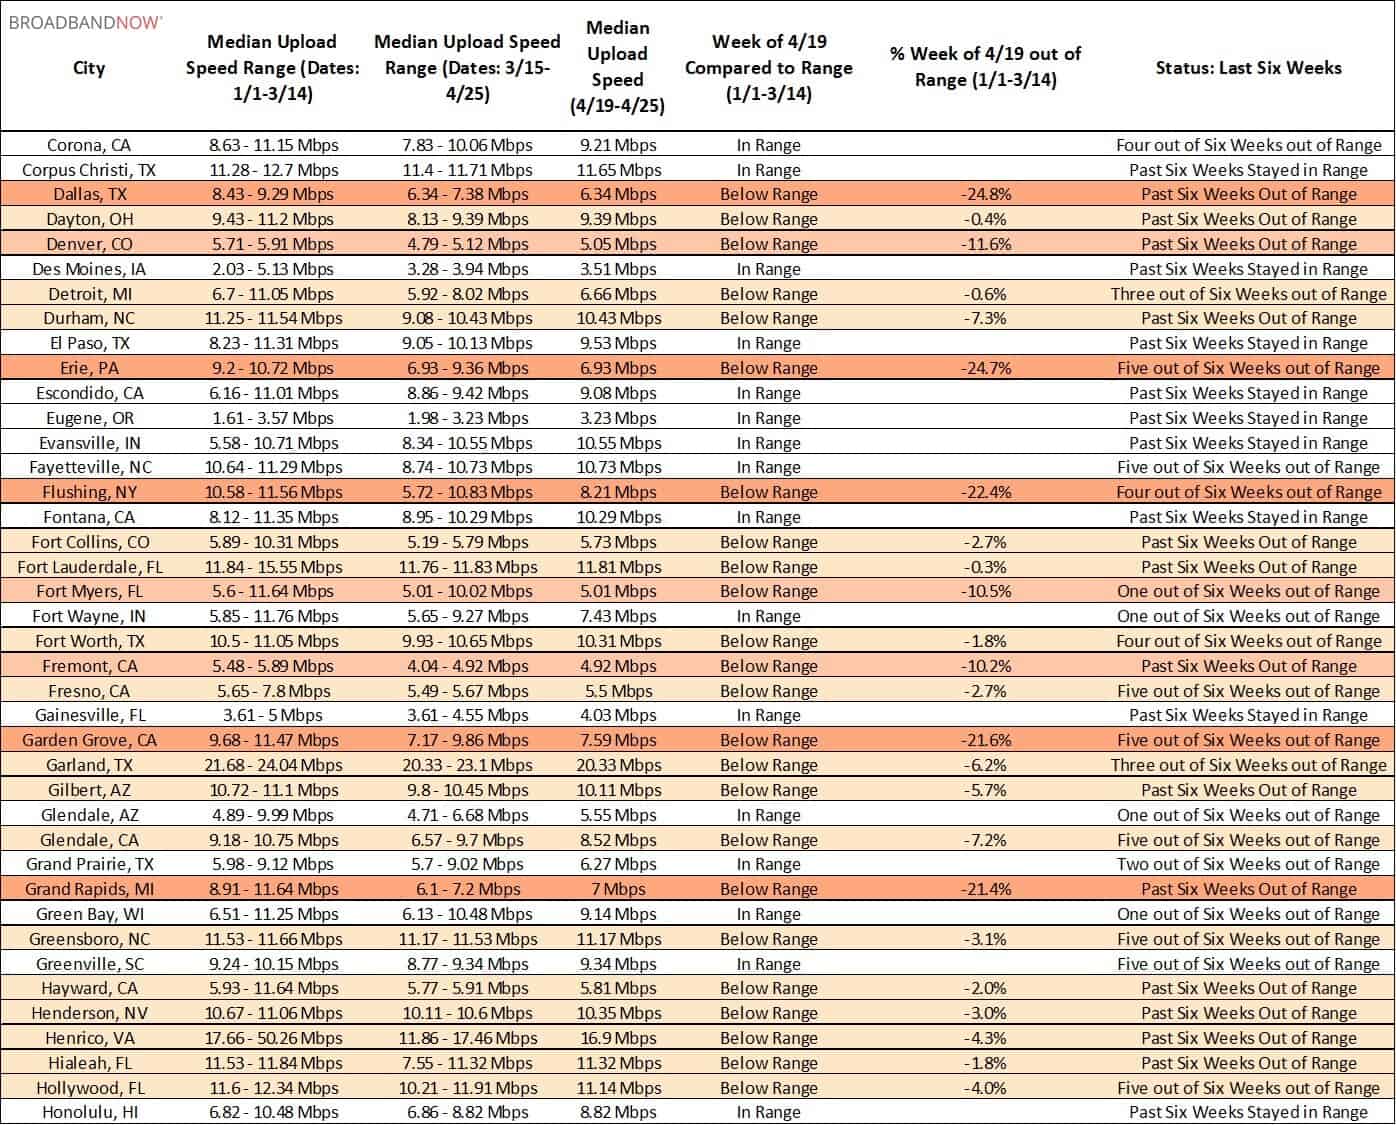
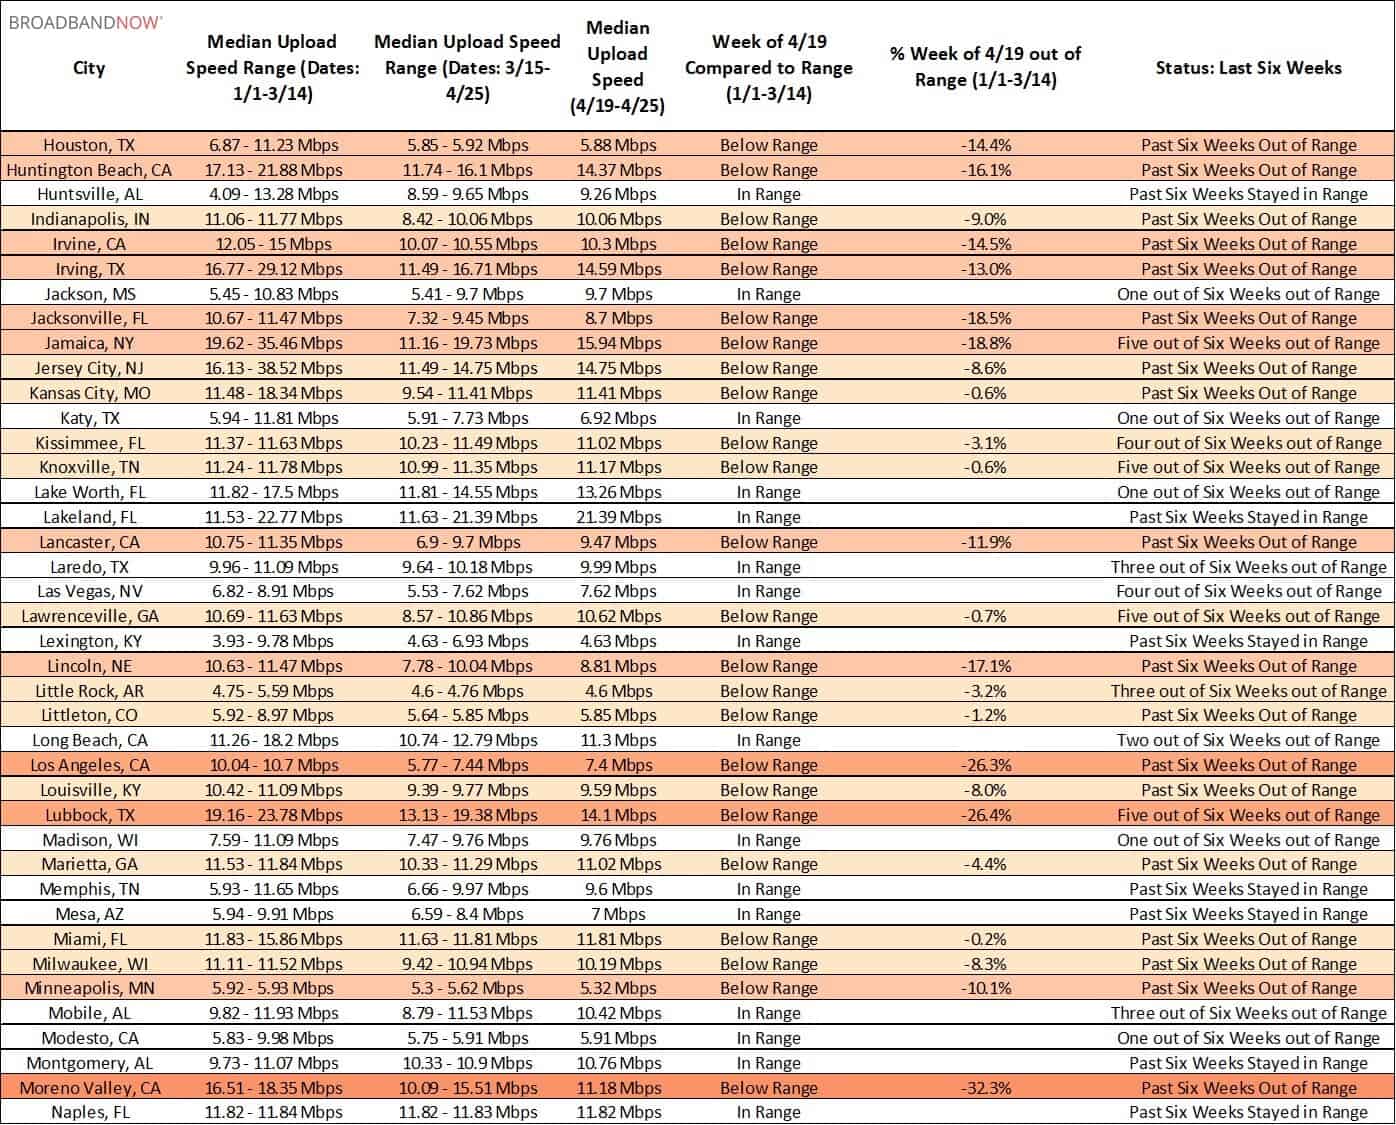
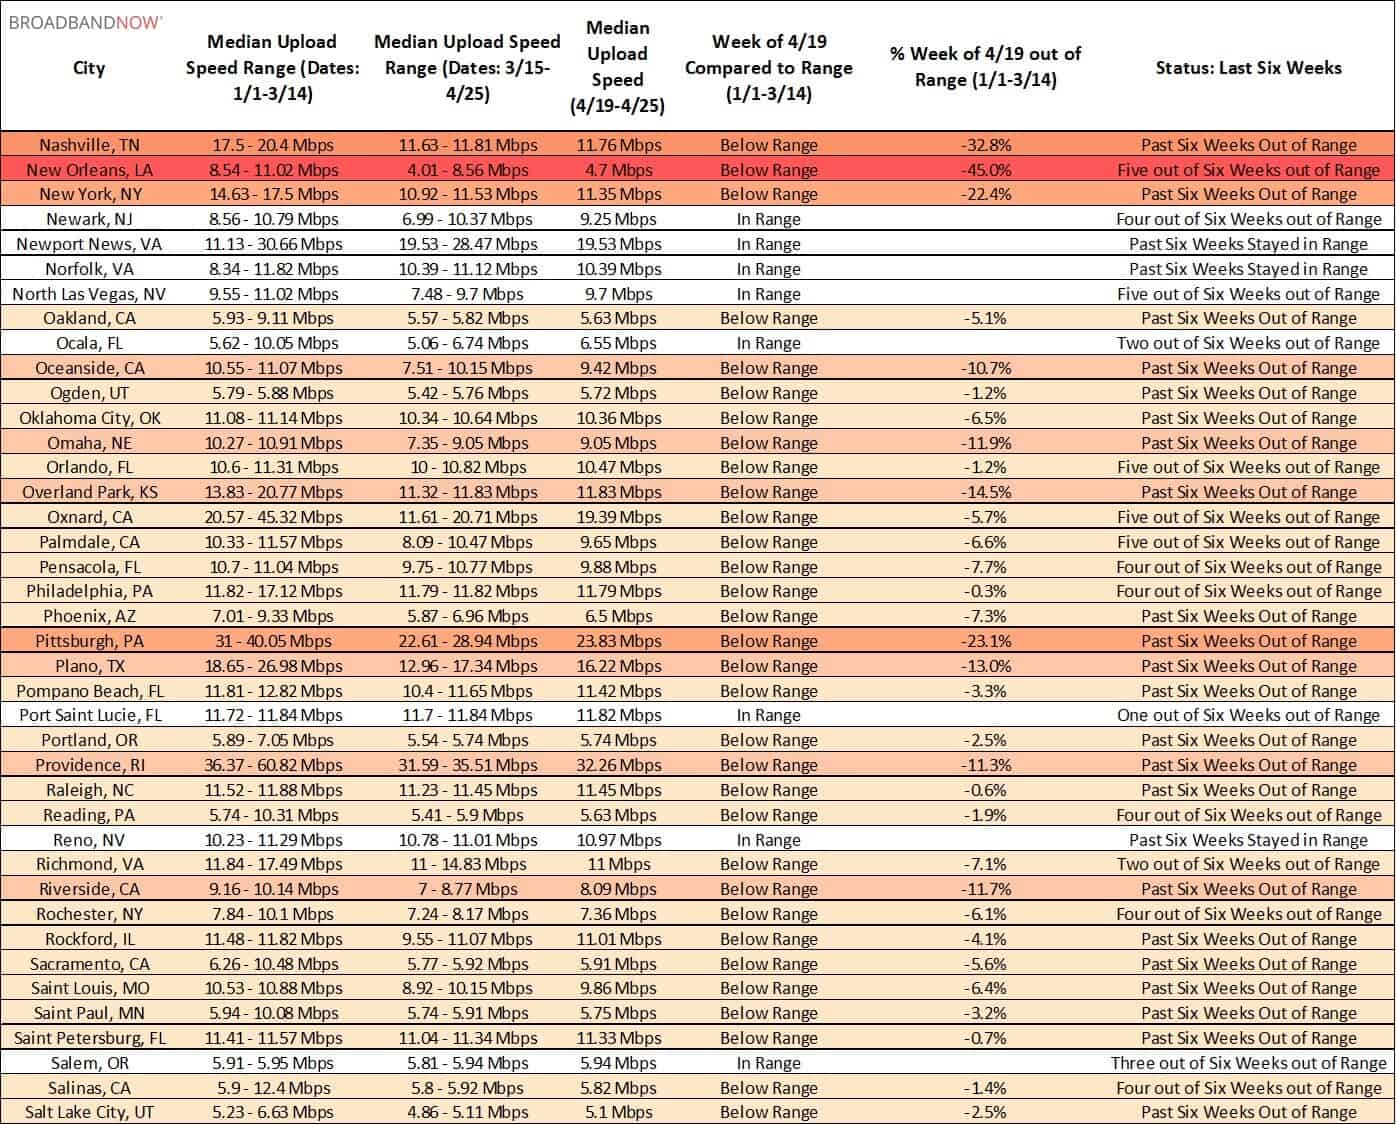
The tables below show both upload and download speed performance over the past five weeks in the 200 most populous cities in the U.S. If a city is “in range,” it means that its current median internet speeds are comparable to the range of speeds recorded over the first 11 weeks in 2020.
Many of the areas struggling the most over the past several weeks have begun to rebound; the number of cities experiencing speed decreases of greater than 40% fell from six to one for upload and from two to zero for download, and the number of cities staying in range of prior weeks has increased as well.
Are you a journalist or researcher writing about this topic?
Contact us and we'll connect you with a broadband market expert on our team who can provide insights and data to support your work.
UPLOAD SPEEDS OVER TIME
Upload speeds rose across the country this week, with 147 cities (73.5% of the top 200) now recording average speeds less than 10% below range. Compared to last week’s 133, or 66.5%, this represents a 7% increase across the country.
Cities that were experiencing significant upload speed disruptions of greater than 40% last week have now begun to recover, including Albuquerque, New Mexico, Boca Raton, Florida, Oxnard, California and Jamaica, New York. Baltimore, Maryland, another city that fell into this category last week, is still struggling, but is beginning to show signs of improvement as well, dipping below 40%.
New Orleans is the sole city experiencing upload speeds 40% or greater below range this week.
The tables below show upload speeds comparing the past six weeks to the weeks of 1/1 to 3/14 for the top 200 U.S. cities by population, in alphabetical order.

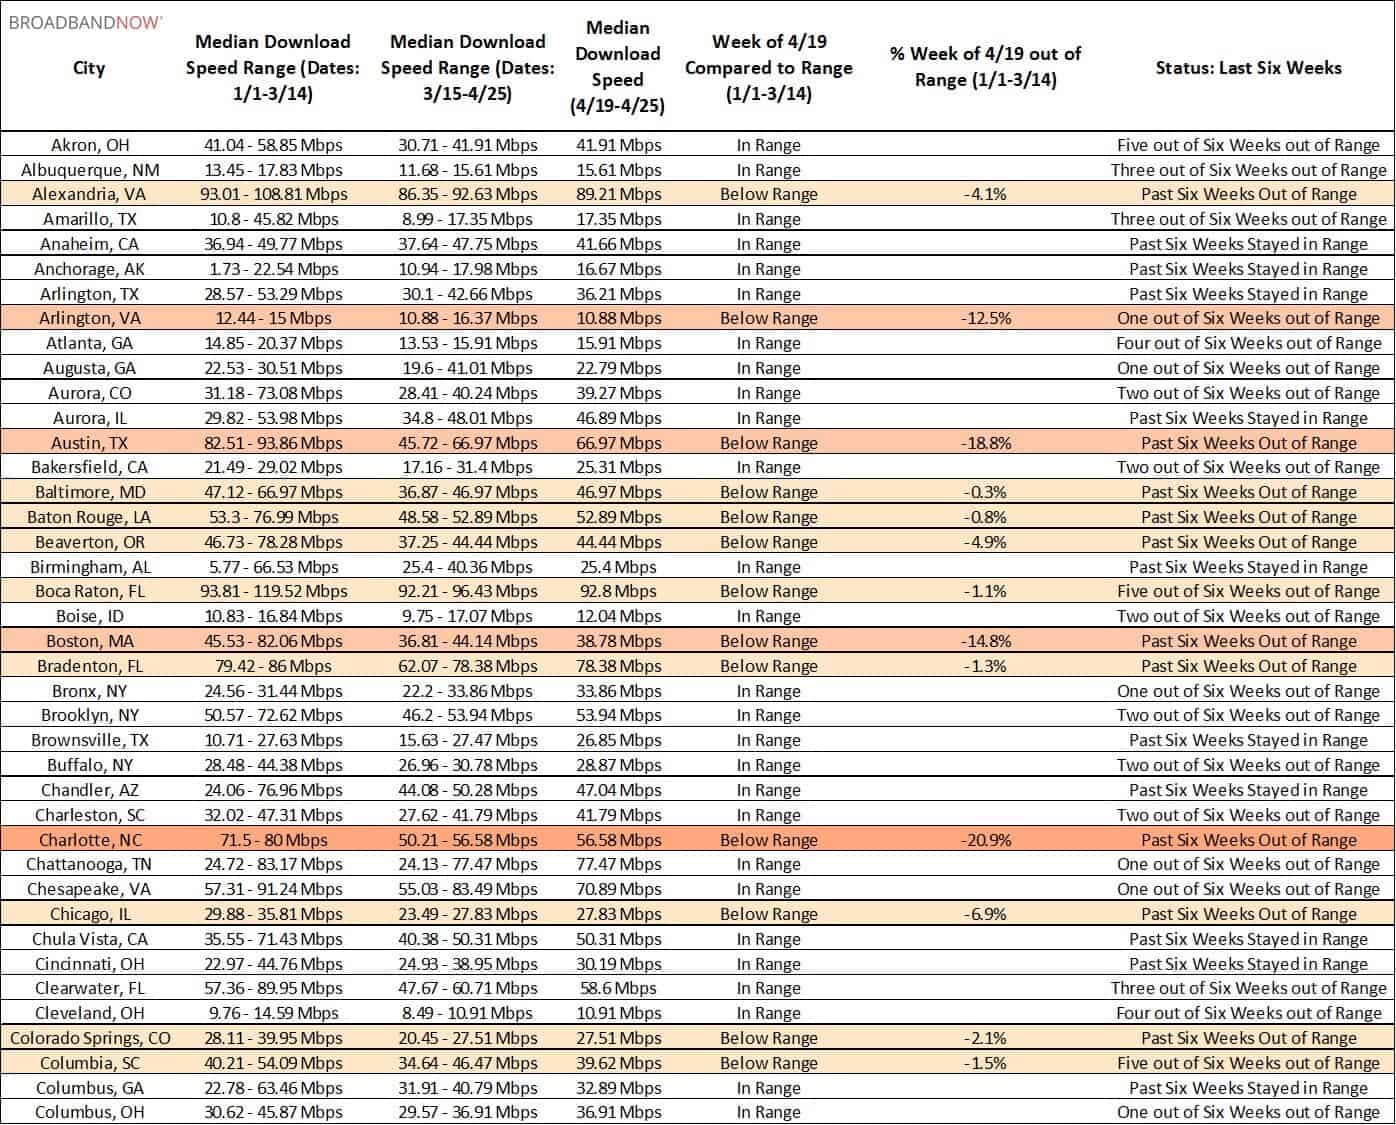
DOWNLOAD SPEEDS OVER TIME
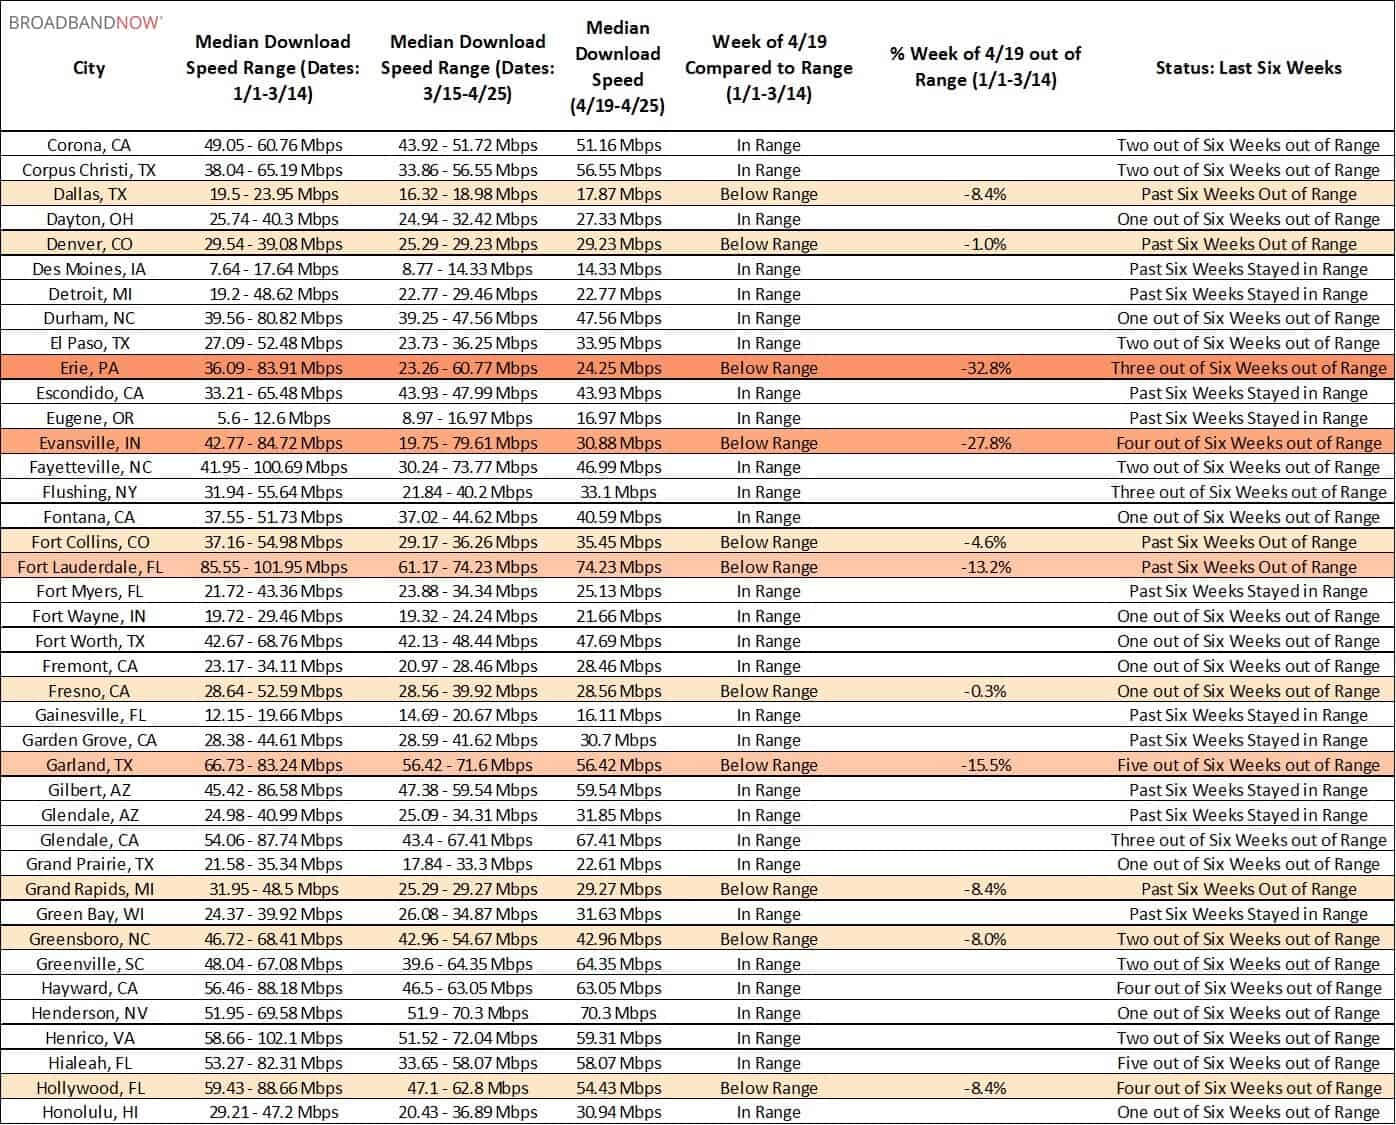
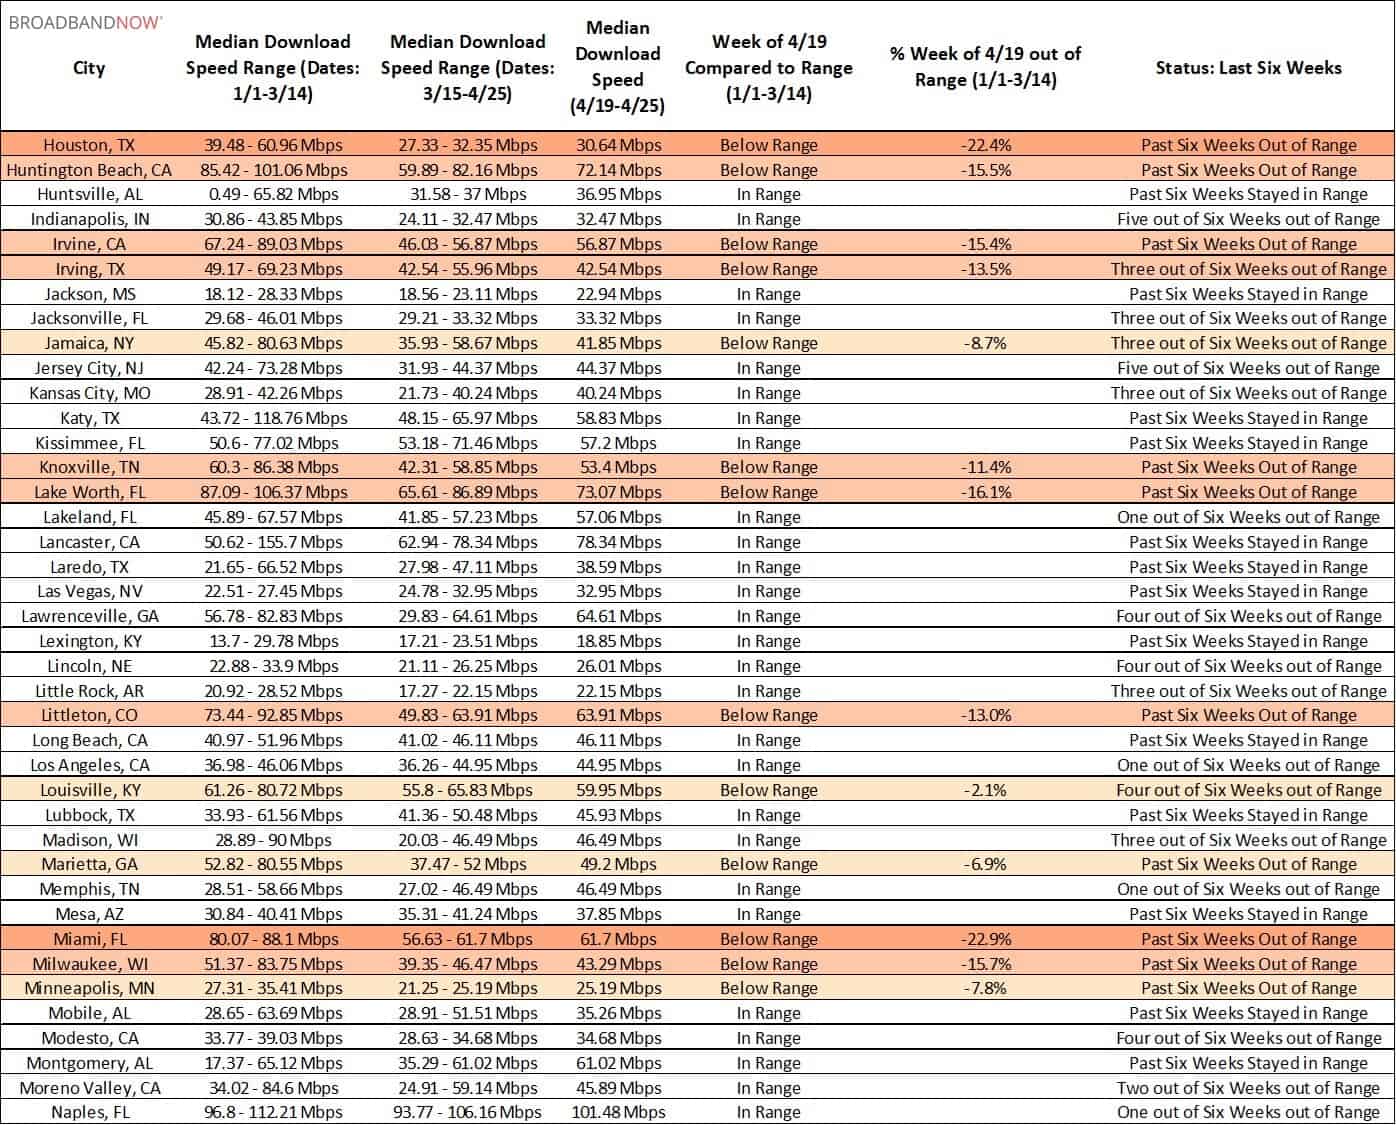
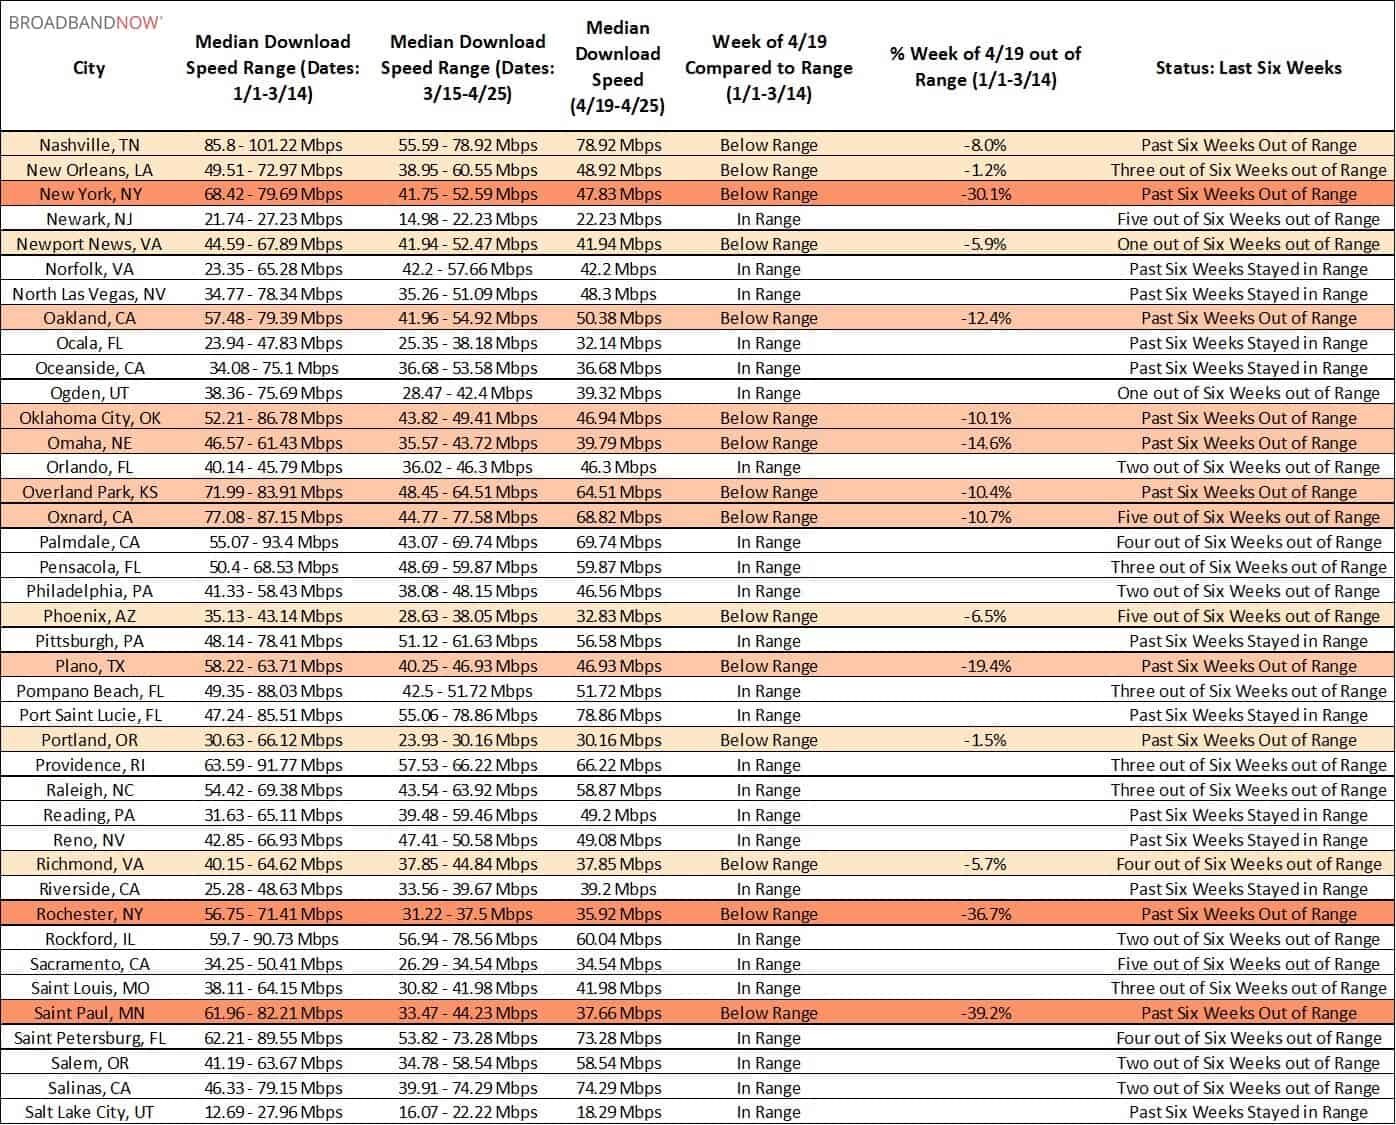
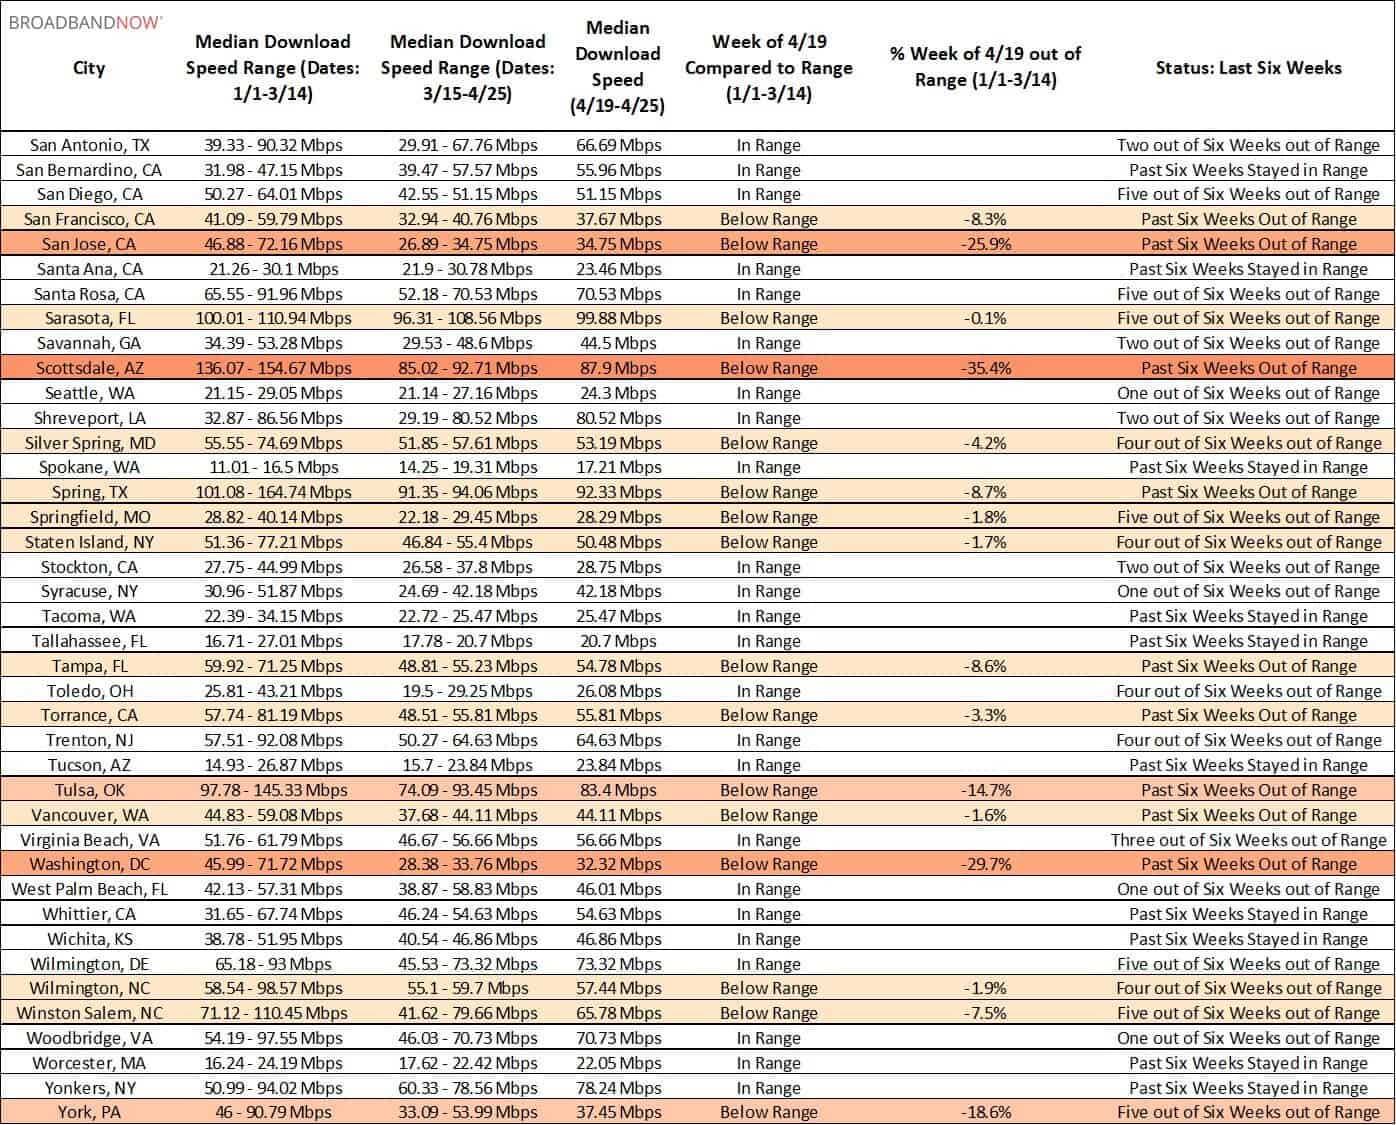
Download speeds have also improved in broad strokes in this week’s report; 169 of the top 200 cities (84.5%) recorded average speeds less than 10% below range – an increase of 10% compared to last week’s 149 cities.
Cities that have been struggling for multiple weeks with download speeds falling 40% or more out of range have now risen out of this category, including Evansville, Indiana and Saint Paul, Minnesota. This week, none of the top 200 cities in the U.S. experienced such significant declines in average download speeds.
Major cities like San Jose, California, New York City, Rochester, New York, and Scottsdale, Arizona continue to see decreases of greater than 30%, but on average, the number of cities in this category has fallen overall.
The tables below show download speeds comparing the past six weeks to the weeks of 1/1 to 3/14 for the top 200 U.S. cities by population, in alphabetical order.
Prior Reports
This report is the latest in a series of reports looking into the stability of American internet networks amid the coronavirus pandemic. You can read prior weeks’ reports below:
- Internet Speed Analysis: Top 200 Cities, March 15th – 21st
- Internet Speed Analysis: Rural, Top 200 Cities March 22nd – 28th
- Internet Speed Analysis: Rural, Top 200 Cities March 29th – April 4th
- Internet Speed Analysis: Rural, Top 200 Cities April 5th – 11th
- Internet Speed Analysis: Rural, Top 200 Cities April 12th – 18th
About The Data
We analyzed raw speed test data from M-Lab for the top 200 cities by population in the U.S. in order to determine how well ISP’s are coping with this unprecedented surge in demand. Data was taken from the past 17 calendar weeks, and we calculated median download speeds and ranges for every city listed based on this information.
We also looked at the rural areas as defined by the CDC’s Urban–Rural Classification Scheme as non-metropolitan areas and measured their speeds, in aggregate, by week. The M-Lab’s data we used includes all users running speed tests on various websites, and does not separate by device type or ISP.