
Every year, we use a combination of public and proprietary data to create a comprehensive report on the quality of the internet in all 50 states and D.C. This year, we analyzed more internet speed tests than ever before, and we are using the most up-to-date internet access data available from the new FCC national broadband fabric, making this the most comprehensive ranking we’ve ever done. More information about our methodology is available at the end of this report.
Our mission is for every American to have equal access to high-speed internet, and our annual rankings show which states have made the most progress toward that end. If our internet availability data could benefit your organization, please contact us.
Key Findings
- Availability of low-priced broadband has increased across the US. There is now only 1 state with less than 20% of the population having access to a broadband plan for $60 per month or less (down from 25 states last year). Having said that, in only one state, Wyoming, more than half of residents have access to such a plan.
- Latency (round trip time) is a measure of responsiveness–the time between when you click something and when you get a response–and it’s critical for a smooth internet experience, especially for real-time interactions such as gaming or video calls. There is a huge geographic disparity between states that do well in this metric, like New York or Washington with median round trip times less than 7.5 milliseconds, and states that do poorly, like Hawai’i and Massachusetts with median round trip times greater than 61 milliseconds.
- We support changing the definition of broadband from 25Mbps down and 3Mbps up to 100Mbps down and 25Mbps up, but we’re a long way away from widespread access to those speeds. Nationally, only 39% of Americans are getting 100Mbps down, and only 25% are getting 25Mbps up.
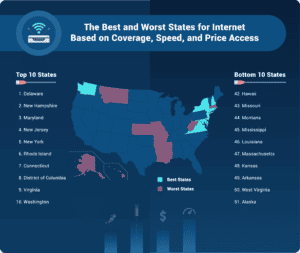
10 Best States for Broadband
10 Worst States for Broadband
Why the best?
These states earned their place in the top 10 through a combination of near universal broadband access, and overall high-quality internet. New Jersey overcame its poor performance in access to low-priced broadband by getting a perfect score in both minimum round-trip time (latency) and upload speed and being 4th in download speed. The top 5 states had perfect scores for upload speed; all others had good scores with Rhode Island coming in the lowest at a 76 out of 100. Both Washington state and D.C. struggled with low download scores that had to be made up elsewhere.
Why the worst?
The worst states are marked by their poor internet quality and low access to low-priced broadband. The 10 worst states almost universally scored below 50 for all three internet quality categories. The only exceptions were Alaska and Mississippi which got scores of 54 and 64 in upload speed respectively, and Hawaii which got a 55 on download score. Massachusetts scored a 0 for both upload speed and minimum round-trip time, while Kansas, Alaska, and Montana each scored at least one 0 for internet quality as well.
State Rankings
Below are the rankings for each state in the US based on access to broadband internet – including access to low price plans and fiber-optics – and the quality of their internet.
Methodology
Our methodology includes scoring each state based on a selection of weighted categories. They are:
- Access to Wired or Fixed Wireless Broadband: 35%
- Access to Wired Low-Priced Broadband: 30%
- Median Round Trip Time: 10%
- Median Download Speed: 10%
- Median Upload Speed: 10%
- Access to Fiber-Optic Service: 5%
Wired or Fixed Wireless Broadband refers to DSL, Copper, Cable, Fiber, or Fixed Wireless connections with at least 25 Mbps download and 3 Mbps upload speed.
Wired Low-Priced Broadband refers to DSL, Copper, Cable, or Fiber connections with at least 25 Mbps download and 3 Mbps upload speed that are also available for $60 per month or less.
Each of these categories is either based on access or quality.
Access:
To assess internet access, we look at three metrics: access to wired or fixed wireless broadband internet, access to low-priced broadband internet, and access to fiber-optic service.
The first two access metrics are the most highly weighted elements in our methodology (making up 65% of the total score) because they both serve as a prerequisite for anything else. If broadband internet is only available to a select few, or if it is so cost prohibitive that only a few can use it, then the quality would be of considerably less importance.
We also consider access to fiber-optic service because it is the fastest and most reliable internet technology available today.
Quality:
To assess internet quality, we analyzed download speed, upload speed, and round trip time, which is a measure of latency. Depending on what you use the internet for, any one of those three metrics could be the most important thing to you. People who play a lot of online competitive video games may consider latency to be the most important, a live streamer or business owner might prioritize upload speed, while an everyday user who mostly uses the internet for watching streaming services could be most interested in download speeds. You can use our bandwidth calculator to find out what’s right for you.
We analyzed over 135 million speed tests from the M-Labs NDT Data Set between November 1st, 2022 to February 28th, 2023 for their upload speed, download speed, and round trip time.
Scoring:
Each state receives a score from 0 to 100 for each of the six categories, and the scores are then weighted and added together to get a final score from 0 to 100.
The three access categories are percentages that already range from 0 to 100, so those were not modified for their score.
The three quality categories were scored by defining the national 65th percentile speed as 100 points and defining the national 35th percentile speed as 0 points, creating a range of speeds around the national median. Each state is then scored based on where its median falls in that national range. Below are the national level statistics used to determine the scores:
- Upload 35th percentile: 6.2 Mbps
Upload median: 11.1 Mbps
Upload 65th percentile: 18 Mbps - Download 35th percentile: 40.9 Mbps
Download median: 77.6 Mbps
Download 65th percentile: 109.7 Mbps - Round trip time 35th percentile: 35.9 ms
Round trip time median: 20.5 ms
Round trip time 65th percentile: 11.3 ms