Access to affordable, reliable broadband internet is critical to America’s economic competitiveness, and impacts education, opportunity and economic growth at the local level. The landscape and geography of access to high-speed internet continues to change rapidly due to economic and regulatory changes, private investments into new technology and policy proposals leading up to the 2020 presidential election.
From Q2 to Q3 we saw a shift towards higher speeds, but also higher prices. With respect to pricing, since our Q2 report there have been more than 700 pricing or plan updates by internet service providers. With respect to speed, this report shows that nearly every state experienced an increase in access to 500 mbps internet. This is predominantly due to the FCC updating its provider coverage data on September 10th.
The State of Digital Inclusion
Percentage of Each State with Access to Affordable Internet
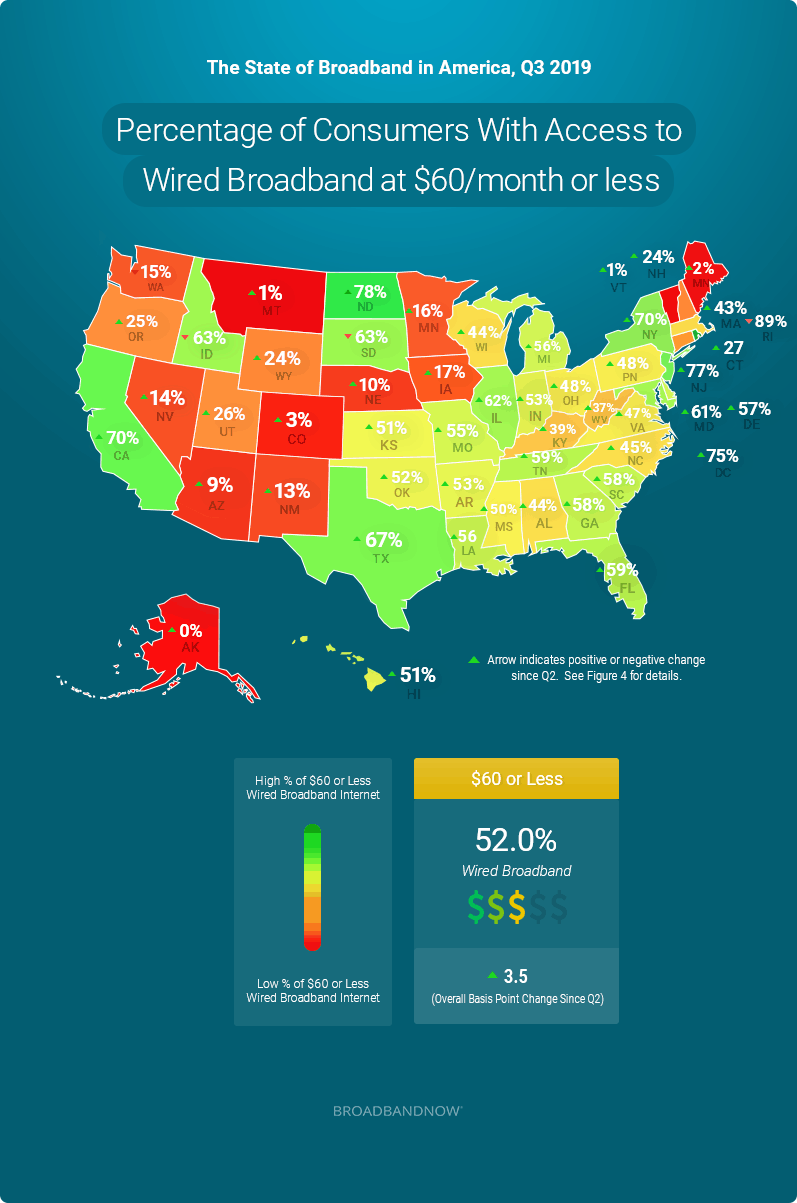
- West Virginia, New Hampshire, Arkansas, Louisiana, and Oklahoma had the largest increases in accessibility quarter-over-quarter to affordable wired internet priced $60 or less.
- Only two states experienced a decrease in access to affordable internet quarter-over-quarter, South Dakota and Idaho.
Percentage of Each State with Access to High Speed Internet
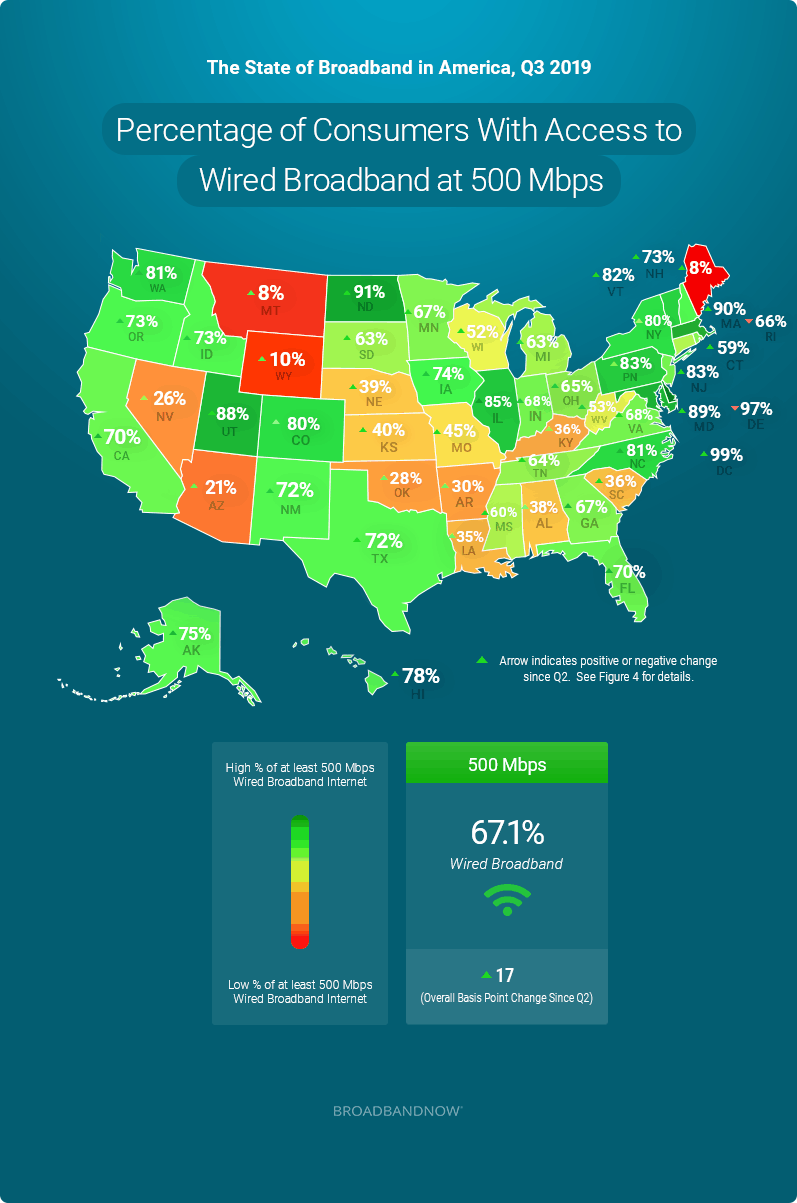
- Compared to our Q2 report, more consumers from 48 states and Washington, D.C. had access to 500 Mbps or faster wired broadband internet. The states with the largest increases were Vermont and Connecticut, up 63.6 and 54.5 basis points*, respectively. This can largely be attributed to Q3’s new updated provider coverage from the latest FCC update that happened at the end of the quarter.
- Two states, Delaware and Rhode Island, had very small drops, less than one basis point*, in access to high-speed.
Percentage of the U.S. Population with Access to Low Priced Wired Broadband
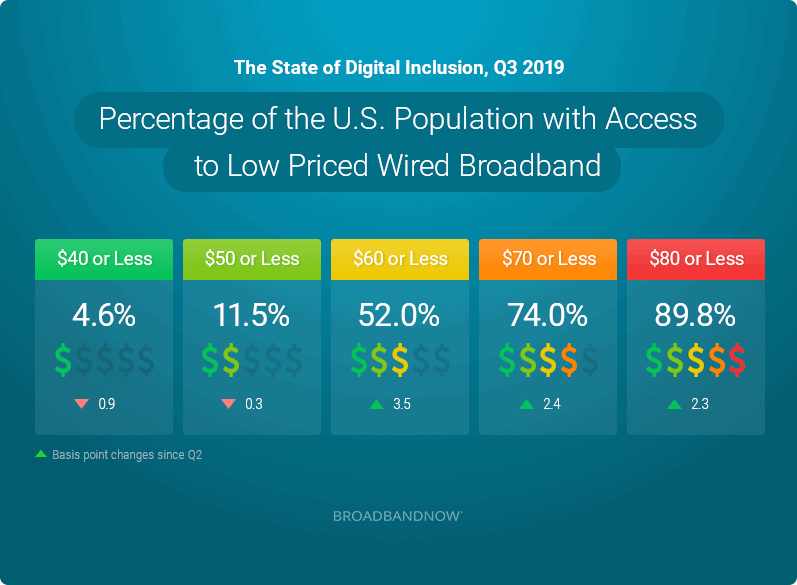
- In general, Q3 had more price increases than decreases. Of plans priced under $60 in Q2 that increased in price in Q3, 62 percent increased to a price greater than $60/month.
- The largest drop was from accessibility of lowest priced stand-alone internet plans $40 and under. $40 and under plans are available to 2.7 million fewer Americans.
- More than half of the new plans added in Q3 were priced higher than $60, with 190 new plans added at price points greater than $80 a month for stand-alone wired broadband.
Percentage of the U.S. Population with Access to High Speeds
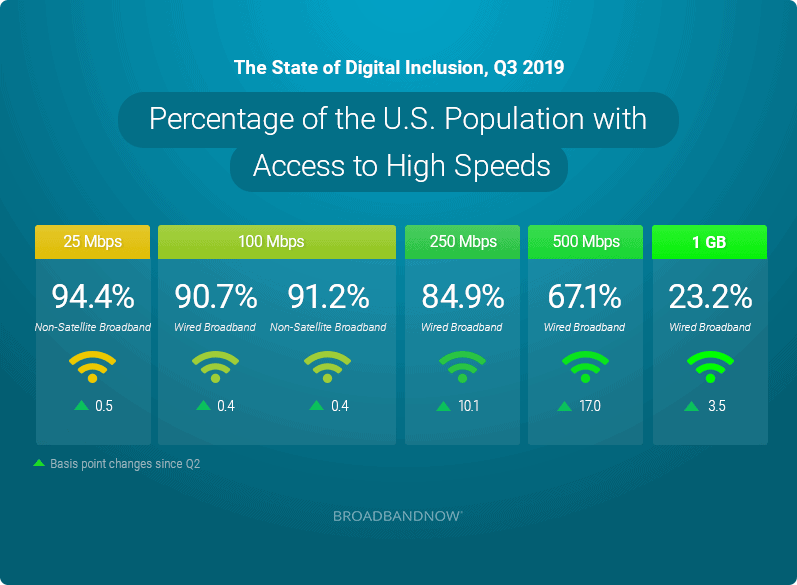
- In Q3 there was an overall increase in accessibility to ultra-fast internet, 500 Mbps or faster, including gigabit speeds. The U.S. population with access to 500 Mbps and one gigabit and up speed was up a combined 20.5 basis points*.
- The 500 Mbps and up category saw gains in the percentage of the population with access to residential plans in this category, up 17 basis points*. Over 52 million more Americans are now able to reach these speeds, with the majority in California.
- 10.7 million Americans had gigabit plans become available in their census block that were not available previously, increasing the percentage of the population with access by 3.5 basis points* since our last report. Notably, 2.6 million additional residents in New York have access to gigabit plans.
Notable Developments in Broadband, Q3
Broadband Policy In The 2020 Election
Several Democratic candidates for the 2020 Presidential election have made broadband expansion a focal point, with candidates like Bernie Sanders, Elizabeth Warren, and Pete Buttigieg each releasing detailed rural connectivity plans over the past several months. Other candidates like Andrew Yang and Amy Klobuchar have also proposed changes to how ownership and usage of personal data is determined.
Fiber Expansion Accelerates
Our data findings illustrate that the industry saw an overall increase in gigabit plan offerings quarter-over-quarter, many of which are backed by fiber technology. As of Q3, 15 percent of Americans have access to gigabit level fiber. Partnerships like the one between Verizon and New York state are helping to build out robust connectivity to rural residents who typically do not have access to the same speeds and pricing available to those in major U.S. cities.
Low Earth Orbit
In our Q2 report, we noted that low-Earth orbit (LEO) providers had submitted FCC filings and were preparing additional tests before launching consumer services in early 2020. Since then, plans have accelerated, with SpaceX asking the FCC on August 30th to adjust the orbital spacing of its satellites in order to speed up its initial coverage of the southern U.S. states.
The company noted that the move would help them establish coverage over the area by the end of the next hurricane season, and stressed how important it would be in order to get robust connectivity to millions of Americans in traditionally underserved and unserved markets.
Elsewhere in the emerging LEO field, upstarts Iridium and OneWeb announced a collaboration on September 17th, potentially bringing a combined service offering to market, and the Canadian government has pledged $521 million in investment funds for newcomer Telesat’s upcoming LEO network
5G Deployment
5G deployment continues apace, with several new 5G-ready devices being released over the past quarter. Major U.S. cities are continuing to see small cell network expansions, and while rural communities are still largely being omitted from initial deployment strategies, companies like Vivint Internet have announced 5G fixed wireless internet services that could soon help bring more rural communities into the digital era.
Community Broadband Continues To Expand Nationwide
Dozens of new municipal broadband networks have come online in Q3 2019, bringing robust connections to thousands of residents across both urban and rural areas. High profile successes such as Ohio’s FairlawnGig are illustrating the transformational potential that these networks have for communities, and despite continued roadblocks in some states, we expect these networks to continue doing excellent work toward closing the digital divide across the entire nation.
Updated National Broadband Map
BroadbandNow released a new interactive national broadband map reflecting the FCC’s most recent provider coverage data, and is currently the only visualization tool that includes pricing data in addition to technology, coverage and speed.
Percentage of the State Population with Access to Affordable & High-Speed Wired Broadband
Figure 4:
| State | Percentage of the Population with Access to $60 Wired Broadband | Basis Points* Change Q2 – Q3 | Percentage of the Population with Access to at least 500 Mbps of Wired Broadband | Basis Points* Change Q2 – Q3 |
|---|---|---|---|---|
| Alabama | 44.4% | 2 | 38.5% | 6 |
| Alaska | 0.0% | – | 75.2% | 1 |
| Arizona | 8.7% | 5 | 20.8% | 3 |
| Arkansas | 52.5% | 17 | 29.6% | 4 |
| California | 70.1% | 2 | 69.6% | 31 |
| Colorado | 3.1% | 0 | 80.4% | 1 |
| Connecticut | 27% | 1 | 59.5% | 55 |
| Delaware | 56.6% | 0 | 96.8 | (0) |
| District of Columbia | 74.7% | 9 | 98.9% | 0 |
| Florida | 59.5% | 1 | 70.1% | 32 |
| Georgia | 57.6% | 3 | 66.5% | 10 |
| Hawaii | 51.3 | 1 | 78.0% | 6 |
| Idaho | 62.7% | (2) | 72.6% | 7 |
| Illinois | 62.3% | 3 | 84.9% | 0 |
| Indiana | 53.4% | 5 | 68.2% | 2 |
| Iowa | 16.5% | 1 | 73.9% | 1 |
| Kansas | 51.2% | 3 | 39.8% | 5 |
| Kentucky | 39.0% | 2 | 35.8% | 6 |
| Louisiana | 56.5% | 14 | 35.0% | 13 |
| Maine | 1.9% | 2 | 8.0% | 0 |
| Maryland | 61.4% | 0 | 89.1% | 0 |
| Massachusetts | 43.3% | 1 | 89.6% | 12 |
| Michigan | 55.9% | 1 | 62.9% | 44 |
| Minnesota | 15.7% | 0 | 66.6 | 2 |
| Mississippi | 49.6% | 4 | 60.5% | 8 |
| Missouri | 49.6 | 4 | 44.8% | 4 |
| Montana | 0.7% | 0 | 8.4% | 2 |
| Nebraska | 10.1% | 0 | 39.1 | 21 |
| Nevada | 13.6% | 1 | 25.7% | 10 |
| New Hampshire | 24.3% | 23 | 72.8% | 7 |
| New Jersey | 77.0% | 1 | 83.4% | 1 |
| New Mexico | 12.5% | 1 | 72.4% | 2 |
| New-York | 69.5% | 1 | 79.9% | 19 |
| North Carolina | 45.3 | 6 | 80.6 | 23 |
| North Dakota | 77.7% | 1 | 91.4% | 15 |
| Ohio | 47.6% | 1 | 65.3% | 43 |
| Oklahoma | 51.8% | 15 | 28.2% | 5 |
| Oregon | 25.2% | 2 | 73.0% | 6 |
| Pennsylvania | 48.1% | 6 | 83.5% | 23 |
| Rhode Island | 88.5% | (1) | 66.4% | (0) |
| South Carolina | 57.7% | 7 | 36.5% | 18 |
| South Dakota | 63.2% | (7) | 62.6% | 0 |
| Tennessee | 59.4% | 1 | 64.3% | 13 |
| Texas | 67.3% | 10 | 71.7% | 19 |
| Utah | 25.5% | 3 | 88.3% | 2 |
| Vermont | 1.1% | 0 | 82.3% | 64 |
| Virginia | 47.4% | 0 | 68.4% | 2 |
| Washington | 15.4% | (0) | 81.1% | 1 |
| West Virginia | 37.2% | 33 | 52.9% | 9 |
| Wisconsin | 43.8 | 2 | 51.6% | 40 |
| Wyoming | 23.8% | 10 | 9.6% | 3 |
About BroadbandNow Data
Data for the Q3 BroadbandNow Quarterly Broadband Report comes from publicly available plan data from more than 2,000 internet service providers from Q3 of 2019. We defined broadband internet as a residential provider plan with at least 25Mbps download and 3Mbps upload speeds, wired broadband as cable, fiber, and DSL technologies, and non-satellite broadband as cable, fiber, DSL, and fixed wireless technologies. Coverage was based on what providers have reported on their most recent FCC Form 477 at the census block level. If a provider has indicated that they have coverage in a census block, we assume that all of the provider’s national plans are also available in that given block. Plan pricing is based on the regular monthly rate offered. Promotional rates are only considered if that is the only advertised price publicly available.
*Basis points shown in this report are 1/100 of the typical basis point calculation where 1% change = 100 basis points and 0.01% = 1 basis point. In this report, a 1% change = 1 basis point.