Key Findings
- 16 states recorded lows in internet speeds in March (compared to the previous five months of speed test data) as the coronavirus continues to spread and more residents are relegated to staying at home.
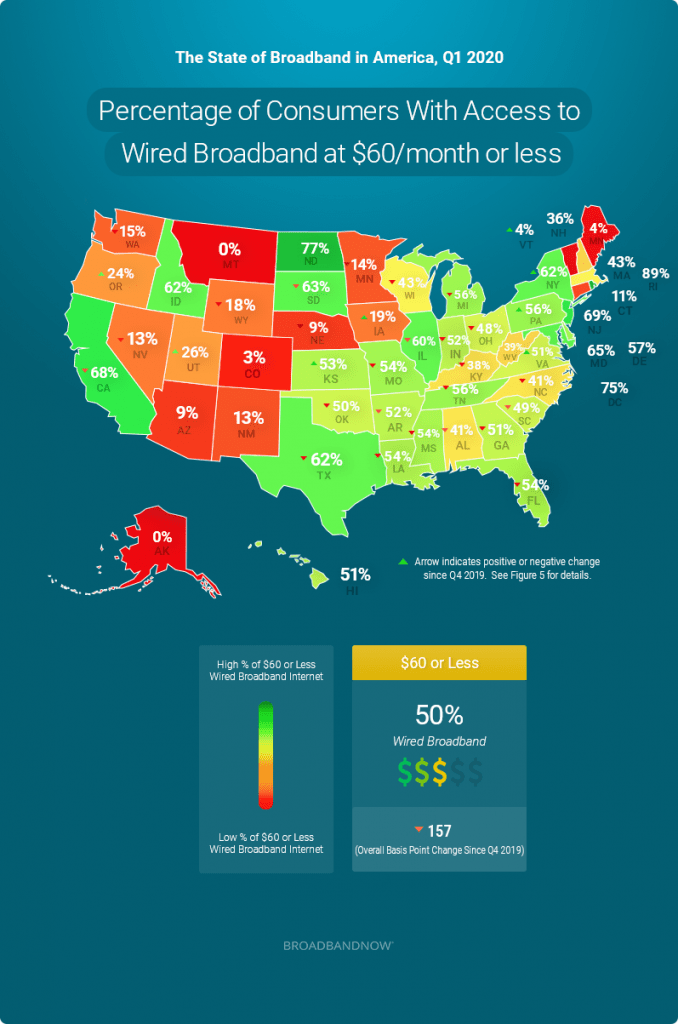
- Overall access to wired low-priced plans (standalone internet plans priced $60/month or less) has dropped from 52% to 50% compared to Q4 2019. Several providers have, however, rolled out additional low-priced plans for qualifying individuals in response to the ongoing situation. As with all of our quarterly reports, we excluded these and other promotional offerings when calculating our statistics.
- 50% of Americans have indicated that they have had to cancel or postpone an in-person medical visit over the last 4 weeks. Despite this, telehealth is not an option for the estimated 48 million Americans currently living without access to a broadband connection.
- States that observed the most significant reductions in access to low-priced broadband plans include Georgia (57.4 > 50.9%), Florida (59.8% > 54.2%), North Carolina (46.3% > 40.9%), and Texas (67.3% > 62.4%).
Speed Changes through the Quarter
Over the past four weeks, we have been tracking speeds in cities and states across the country amid the mass shift into remote working and living. We’ve found that speeds in many of the 200 most populous cities have fallen during this time.
You can read our week-by-week reports here:
Compared to October 2019 – February 2020, 16 states recorded their lowest median speeds in March when Covid-19 rates in the U.S. started to peak.
16 states recorded their lowest median internet speeds over the past six months in March, potentially pointing to networks feeling the strain of millions of Americans suddenly trying to stay connected at all hours of the day using their home internet. The Midwest and South were particularly affected by speed degradations. States that saw significant disruptions include the following:
- Alabama
- Delaware
- Florida
- Georgia
- Iowa
- Illinois
- Indiana
- Louisiana
- Michigan
- Missouri
- New Hampshire
- New Jersey
- Tennessee
- Wisconsin
- West Virginia
- Wyoming
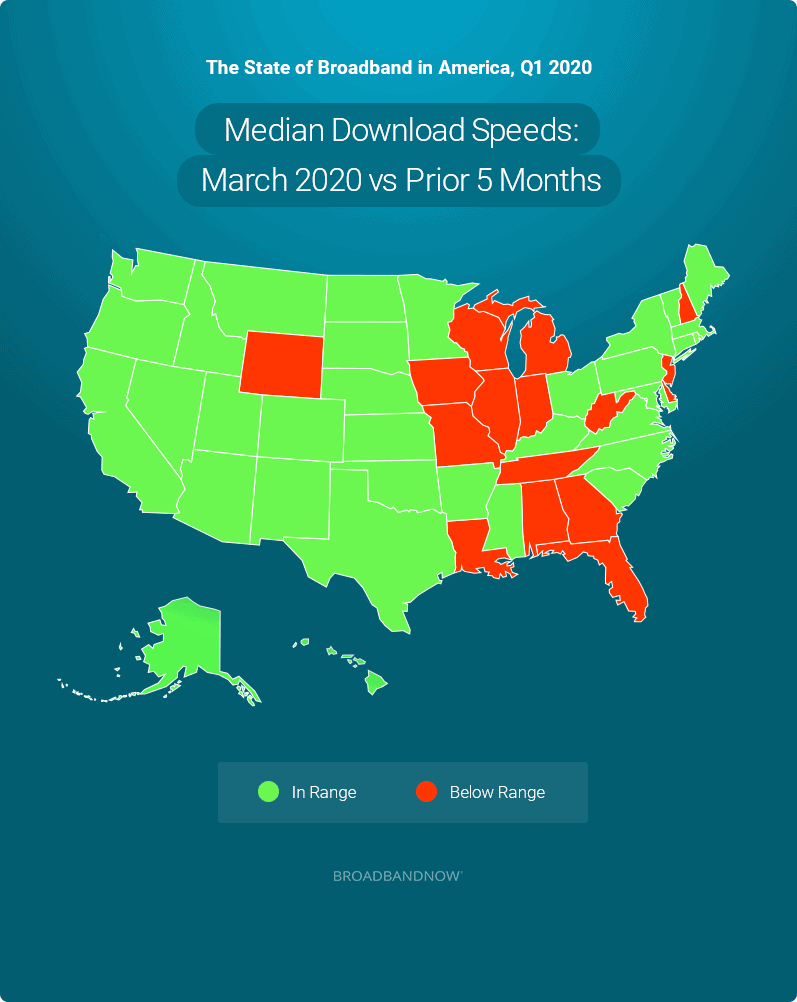
This would indicate that the majority of states are experiencing some degree of network strain from the sudden and mass transition into a “work-from-home, learn-from-home” lifestyle. Still, 18 states have not experienced any noteworthy degradation, including states hit hard by the COVID-19 outbreak like Washington and California.
Median* Download Speed (Mbps) – Q1 of 2020
| State | Jan | Feb | Mar | % Change in March compared to Avg of Jan/Feb |
|---|---|---|---|---|
| AK | 2.22 | 6.75 | 8.43 | 88% |
| AL | 15.02 | 15.84 | 12.45 | -19% |
| AR | 12.53 | 14.20 | 15.27 | 14% |
| AZ | 28.01 | 28.16 | 26.39 | -6% |
| CA | 23.37 | 27.54 | 28.01 | 10% |
| CO | 28.24 | 28.10 | 25.85 | -8% |
| CT | 15.92 | 35.51 | 29.45 | 15% |
| DC | 24.72 | 25.07 | 23.57 | -5% |
| DE | 40.04 | 48.98 | 39.65 | -11% |
| FL | 35.14 | 37.65 | 32.65 | -10% |
| GA | 22.08 | 22.43 | 19.48 | -12% |
| HI | 22.23 | 27.12 | 19.96 | -19% |
| IA | 14.26 | 14.04 | 10.88 | -23% |
| ID | 9.77 | 10.45 | 11.08 | 10% |
| IL | 23.55 | 24.06 | 20.44 | -14% |
| IN | 22.09 | 20.78 | 15.37 | -28% |
| KS | 25.09 | 22.90 | 25.48 | 6% |
| KY | 16.25 | 13.74 | 13.75 | -8% |
| LA | 23.78 | 21.91 | 20.88 | -9% |
| MA | 36.65 | 44.30 | 40.54 | 0% |
| MD | 39.93 | 44.37 | 35.89 | -15% |
| ME | 15.27 | 17.19 | 16.95 | 4% |
| MI | 20.41 | 22.84 | 17.45 | -19% |
| MN | 23.22 | 26.60 | 20.87 | -16% |
| MO | 16.06 | 16.24 | 14.18 | -12% |
| MS | 8.54 | 10.72 | 8.68 | -10% |
| MT | 28.25 | 30.76 | 28.43 | -4% |
| NC | 16.56 | 17.90 | 17.70 | 3% |
| ND | 27.27 | 16.68 | 25.38 | 15% |
| NE | 19.72 | 22.28 | 20.54 | -2% |
| NH | 49.58 | 56.54 | 41.73 | -21% |
| NJ | 39.62 | 39.65 | 36.33 | -8% |
| NM | 13.47 | 12.86 | 12.30 | -7% |
| NV | 20.19 | 20.76 | 23.37 | 14% |
| NY | 31.09 | 32.73 | 30.73 | -4% |
| OH | 10.87 | 15.08 | 16.99 | 31% |
| OK | 19.44 | 22.76 | 22.64 | 7% |
| OR | 20.06 | 23.71 | 19.91 | -9% |
| PA | 26.31 | 32.69 | 28.65 | -3% |
| RI | 41.80 | 47.81 | 45.86 | 2% |
| SC | 27.51 | 25.92 | 27.94 | 5% |
| SD | 13.43 | 14.26 | 14.81 | 7% |
| TN | 28.86 | 28.67 | 24.13 | -16% |
| TX | 20.45 | 27.87 | 24.17 | 0% |
| UT | 31.46 | 34.37 | 26.42 | -20% |
| VA | 26.35 | 28.61 | 22.69 | -17% |
| VT | 13.75 | 13.84 | 11.19 | -19% |
| WA | 16.87 | 18.01 | 20.19 | 16% |
| WI | 18.50 | 22.98 | 16.51 | -20% |
| WV | 13.93 | 12.47 | 10.50 | -20% |
| WY | 21.06 | 22.65 | 16.22 | -26% |
* The M-Lab’s data we used includes all users running speed tests on various websites, and does not separate by device type or ISP.
Access to Low Priced Plans
Compared to Q4 of 2019, overall access to wired low priced plans (standalone internet plans priced $60/month or less) has dropped from 52% to 50%. Similarly, there was a very slight drop in the percent of the population with access to $40 or less plans (a 25 basis point decrease).
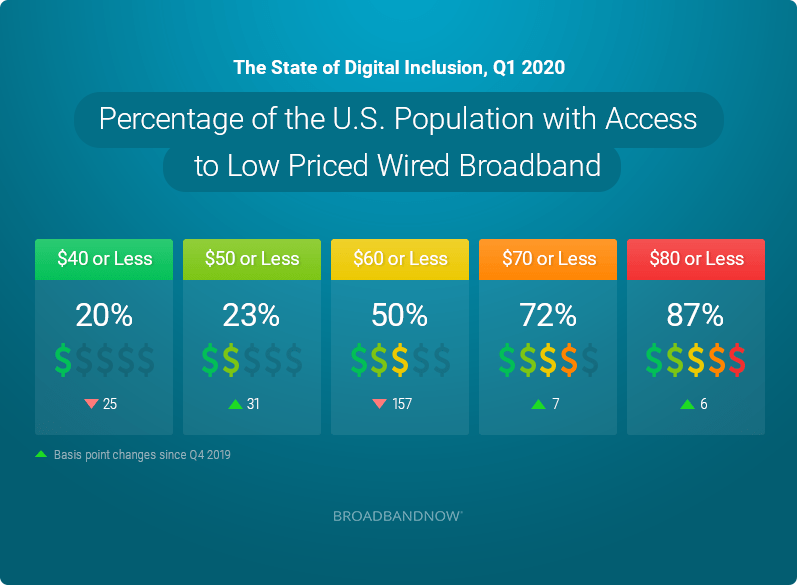
Other categories, such as access to plans $50 or less, $70 or less, and $80 or less all saw only slight increases (31, 7, and 6 basis points, respectively). All in all, 18 states experienced no changes from last quarter.
279 plans offered by wired providers changed prices during Q1. Nearly half of these (48%) were fiber-based plans.
Access to Low Priced Plans Q1 of 2020
| State | Q4 2019 | Q1 2020 | Basis Point Change |
|---|---|---|---|
| AK | 0.0% | 0.0% | 0 |
| AL | 44.4% | 41.0% | (338) |
| AR | 52.3% | 52.1% | (23) |
| AZ | 8.7% | 8.7% | 0 |
| CA | 70.0% | 68.4% | (163) |
| CO | 3.0% | 3.0% | 0 |
| CT | 10.7% | 10.7% | 0 |
| DC | 74.7% | 74.7% | 0 |
| DE | 57.1% | 57.1% | 0 |
| FL | 59.8% | 54.2% | (562) |
| GA | 57.4% | 50.9% | (647) |
| HI | 51.3% | 51.3% | 0 |
| IA | 17.2% | 18.9% | 170 |
| ID | 62.3% | 62.3% | 0 |
| IL | 62.2% | 59.9% | (233) |
| IN | 53.9% | 51.7% | (217) |
| KS | 51.1% | 53.0% | 196 |
| KY | 39.6% | 38.0% | (158) |
| LA | 56.5% | 53.5% | (293) |
| MA | 43.3% | 43.3% | 0 |
| MD | 65.4% | 65.4% | 0 |
| ME | 4.5% | 4.5% | 0 |
| MI | 56.3% | 55.8% | (59) |
| MN | 13.6% | 13.5% | (6) |
| MO | 55.3% | 54.5% | (81) |
| MS | 56.8% | 54.2% | (263) |
| MT | 0.2% | 0.2% | 0 |
| NC | 46.3% | 40.9% | (547) |
| ND | 76.8% | 76.8% | 0 |
| NE | 10.8% | 9.2% | (168) |
| NH | 36.4% | 36.4% | 0 |
| NJ | 69.3% | 69.3% | 0 |
| NM | 12.5% | 12.5% | 0 |
| NV | 13.6% | 13.1% | (53) |
| NY | 62.3% | 62.3% | 0 |
| OH | 49.6% | 48.2% | (141) |
| OK | 52.4% | 49.7% | (267) |
| OR | 24.5% | 24.5% | 2 |
| PA | 51.6% | 56.4% | 483 |
| RI | 88.5% | 88.5% | 0 |
| SC | 52.4% | 49.2% | (324) |
| SD | 63.2% | 62.6% | (66) |
| TN | 59.4% | 56.3% | (309) |
| TX | 67.3% | 62.4% | (483) |
| UT | 25.5% | 25.5% | 3 |
| VA | 48.8% | 51.3% | 257 |
| VT | 1.1% | 3.9% | 285 |
| WA | 15.4% | 15.2% | (19) |
| WI | 44.2% | 42.7% | (158) |
| WV | 39.3% | 39.3% | 0 |
| WY | 19.3% | 18.4% | (86) |
The Coronavirus
Across the industry, providers have reacted to the evolving situation millions of Americans now find themselves in. Many providers have removed data caps temporarily, as well as increased speeds on base-level internet plans. Over 700 companies in total have now signed the Keep Americans Connected Pledge, which states that they agree to:
- Not terminate service to any residential or small business customers because of their inability to pay their bills due to the disruptions caused by the coronavirus pandemic
- Waive any late fees that any residential or small business customers incur because of their economic circumstances related to the coronavirus pandemic
- Open its Wi-Fi hotspots to any American who needs them.
Several companies are even offering free access for up to two months for those without a connection.
Click here for a guide to internet options during the coronavirus pandemic.
Telehealth
Telehealth is being touted as a potential solution for overwhelmed healthcare systems in many states, but as many as 42 million Americans may not have the broadband connection to support this emerging service. Despite this, a recent survey conducted showed that 75% of American adults were open to a virtual visitation as an alternative to an in-person appointment, many of which have been canceled or postponed over the last several weeks.
LEO Updates
Low Earth orbit satellite operations have had a mixed quarter in terms of progress. SpaceX now has over 350 satellites in orbit, having completed its sixth delivery mission into space in mid March. Other companies, however, have hit snags that may affect their entrance to the market, including UK-based startup OneWeb, which recently filed for Chapter 11 restructuring after running into financial troubles early in the quarter.
2020 Census
The 2020 census is officially underway, and its potential impact on the way we currently measure the digital divide cannot be overstated. The FCC’s Form 477 is the “source of truth” used for broadband infrastructure planning initiatives, despite relying on outdated census block information from more than 10 years ago. The new census should give us a far more accurate look at how our population has shifted and spread over the 2010’s, and this information could be vital for those working to bring connections to the so-called “internet deserts” that exist in virtually every state.
About the data
Data for the 2020 Q1 BroadbandNow Report comes from publicly available plan data from more than 2,000 internet service providers in the first quarter of 2020. We defined broadband internet as a residential provider plan with at least 25 Mbps download and 3 Mbps upload speeds, wired broadband as all cable, fiber, and DSL technologies, and non-satellite broadband as cable, fiber, DSL, and fixed wireless technologies.
Low priced plan coverage was based on what providers have reported on their most recent FCC Form 477 submission at the census block level. If a provider has indicated that they have coverage in a given census block, we assume that all of the provider’s national plans are also available in that block, as well as any regional plans serving those blocks. Plan pricing is based on the regular monthly rate offered. Promotional rates are only considered if that is the only advertised price publicly available. Speed test data comes from M-Lab.

Written by