In 2020, we manually checked availability of more than 11,000 addresses using Federal Communications Commission (FCC) Form 477 data as the “source of truth.” Based on the results, we estimated that as many as 42 million Americans did not have the ability to purchase broadband internet at the time.
Since then, quite a bit has changed. The FCC has moved away from the outdated and flawed Form 477 reporting mechanism, the Broadband Equity, Access and Deployment (BEAD) grant program has become the primary model for government intervention on the digital divide, and the FCC has provided a new dataset for states to use for allocating the billions of dollars they will receive through this once-in-a-generation program.
Over the past six months, our team has been manually checking availability at nearly 65,000 addresses spread across all U.S. states (except for Alaska and Hawaii) and comparing those findings to the FCC’s new mapping fabric. What we have found is that overreporting continues to be rampant, and exists in every state, across every technology type.
- BroadbandNow Research selected 11 large ISPs with “check availability” tools. These tools allow users to enter an address and receive a response as to whether wired and/or fixed wireless service is available.
- From there, we selected nearly 65,000 addresses (from a set of more than 1 million) where at least one of these 11 ISPs offer service according to the FCC’s availability data.
- We checked each address/provider combination, totaling 113,686 address-provider checks. We found that for 22.1 percent of combinations, the ISP’s tool indicates service is not available.
- Some addresses are serviced by more than one of the 11 large ISPs according to FCC data. For 1.27 percent of addresses, none of the ISPs’ tools indicate service is available
Key Findings
- The FCC claimed that roughly 21 million Americans still had no access to a broadband internet connection meeting the 25 Mbps download / 3 Mbps upload threshold as of the time we generated the data used in this study. Based on our findings, we estimate that an additional million Americans do not have service, totalling 22 million.
- Texas has the most Americans without broadband in total, with 1.8 million lacking access to a 25/3 connection.
- While all technologies are overstated in terms of coverage, DSL and fixed wireless were the worst offenders in the sample set, at 53% and 58%, respectively.
Estimating Broadband Availability By State
BroadbandNow Research checked more than 1,000 addresses manually in each state, except for Alaska and Hawaii, which we have excluded. Below is a map of unserved Americans by state, comparing FCC data to our manual checks across the country.

Overreporting by State
Although overreporting varies widely from state to state, it exists across the country. This is significant, as states are due to begin making decisions about where and how to deploy the millions of dollars they will be receiving through BEAD, and they will be utilizing this overstated data to do so. Below is a table showing the FCC’s estimate of residents without broadband access, compared to BroadbandNow’s estimate.
| State | Overreporting Percent | FCC’s Unserved Americans Estimate | BBN Unserved Americans Estimate | Population |
|---|---|---|---|---|
| Alabama | 6% | 1,054,706 | 1,116,590 | 4,902,000 |
| Arizona | 9% | 314,833 | 342,696 | 7,279,000 |
| Arkansas | 6% | 544,051 | 576,524 | 3,018,000 |
| California | 6.7% | 1,199,574 | 1,279,378 | 39,538,223 |
| Colorado | 6% | 201,186 | 214,223 | 5,758,000 |
| Connecticut | 17% | 76,558 | 89,489 | 3,605,944 |
| Delaware | 13% | 4,645 | 5,252 | 974,000 |
| Florida | 7% | 1,232,869 | 1,321,232 | 21,477,000 |
| Georgia | 6% | 928,510 | 988,274 | 10,614,000 |
| Idaho | 0.3% | 114,315 | 114,708 | 1,787,000 |
| Illinois | 1% | 403,130 | 408,888 | 12,672,000 |
| Indiana | 3.7% | 391,568 | 406,128 | 6,732,000 |
| Iowa | 1% | 126,019 | 127,565 | 3,155,000 |
| Kansas | 1.3% | 96,772 | 98,111 | 2,913,000 |
| Kentucky | 5.5% | 707,590 | 747,089 | 4,468,000 |
| Louisiana | 6% | 800,897 | 848,193 | 4,649,000 |
| Maine | 6.6% | 150,593 | 160,559 | 1,344,000 |
| Maryland | 4% | 115,444 | 120,071 | 6,046,000 |
| Massachusetts | 39% | 86,020 | 119,702 | 6,892,503 |
| Michigan | 11% | 968,282 | 1,073,869 | 9,986,857 |
| Minnesota | 0.8% | 286,902 | 289,255 | 5,700,671 |
| Mississippi | 2% | 799,885 | 819,252 | 2,975,000 |
| Missouri | 1.6% | 428,228 | 435,304 | 6,136,000 |
| Montana | 3.8% | 229,468 | 238,169 | 1,069,000 |
| Nebraska | 2.5% | 106,766 | 109,455 | 1,934,000 |
| Nevada | 4.7% | 48,171 | 50,441 | 3,080,000 |
| New Hampshire | 16% | 91,254 | 106,298 | 1,360,000 |
| New Jersey | 5.7% | 246,523 | 260,754 | 8,882,190 |
| New Mexico | 2.5% | 248,244 | 254,665 | 2,096,000 |
| New York | 13.7% | 777,418 | 883,888 | 19,453,561 |
| North Carolina | 5% | 1,229,580 | 1,295,238 | 10,488,000 |
| North Dakota | 1% | 29,254 | 29,282 | 762,000 |
| Ohio | 7.3% | 728,438 | 781,659 | 11,689,100 |
| Oklahoma | 3.5% | 301,778 | 312,556 | 3,954,000 |
| Oregon | 5% | 299,552 | 314,403 | 4,218,000 |
| Pennsylvania | 3.5% | 785,312 | 812,975 | 12,802,000 |
| Rhode Island | 52.8% | 8,653 | 13,227 | 1,059,000 |
| South Carolina | 4% | 479,536 | 500,052 | 5,149,000 |
| South Dakota | 1.7% | 64,692 | 65,810 | 885,000 |
| Tennessee | 16% | 545,367 | 631,857 | 6,829,000 |
| Texas | 2% | 1,810,316 | 1,849,329 | 29,145,505 |
| Utah | 0.5% | 73,345 | 73,714 | 3,206,000 |
| Vermont | 2.3% | 95,905 | 98,116 | 624,000 |
| Virginia | 7.5% | 716,774 | 771,157 | 8,541,000 |
| Washington | 3% | 515,361 | 532,208 | 7,614,000 |
| Washington, D.C. | 1.6% | 1,670 | 1,698 | 706,000 |
| West Virginia | 2% | 668,679 | 681,630 | 1,792,000 |
| Wisconsin | 2% | 629,869 | 643,265 | 5,822,000 |
| Wyoming | 3% | 54,294 | 55,953 | 579,000 |
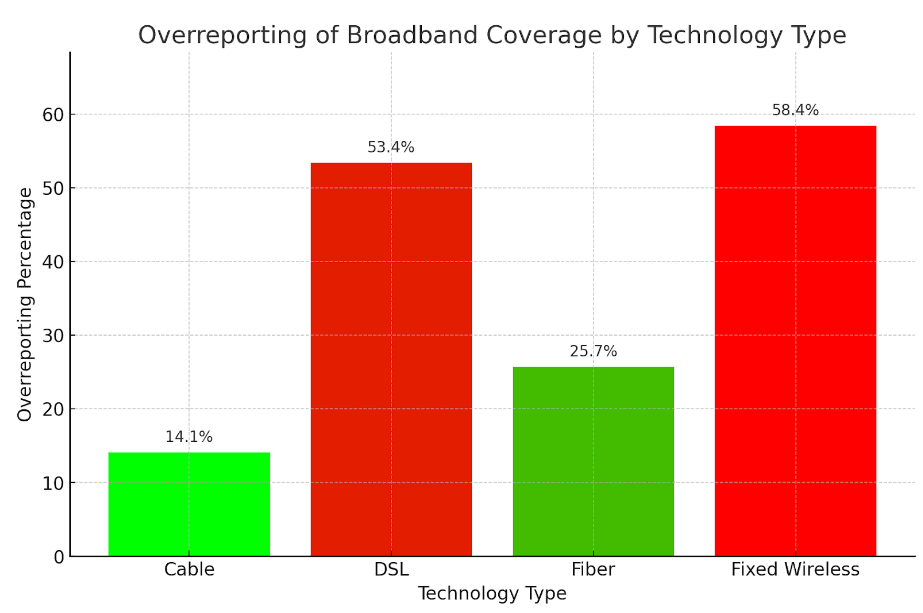
Overreporting Stats by Tech Type
While all types of internet coverage is overstated, some were moreso, like fixed wireless and DSL. In the case of DSL, this might be partially due to providers winding down support for the service in many markets, while still claiming coverage in those areas to the FCC.
Here is a breakdown of national overreporting by technology, nationwide:
- Cable – 14.1%
- DSL – 53.4%
- Fiber – 25.7%
- Fixed Wireless – 58.4%
Improving Mapping Efforts Going Forward
We believe that crowdsourced studies like ours are one way to improve the quality and reliability of broadband data being collected today. More broadly, there are several arguments for how to proceed with improving broadband mapping efforts in the U.S.:
- Incorporate more granular and accurate data: The FCC’s current mapping relies too heavily on data self-reported by internet service providers (ISPs). We advocate for the use of more detailed, location-specific data gathered through on-the-ground surveys, crowdsourcing, and other verification methods to get a truer picture of broadband availability and speeds.
- Use a variety of data sources: We argue for integrating data from multiple sources beyond just ISP reporting, such as speed test data, consumer feedback, and information from state and local governments. Triangulating data points could help paint a more comprehensive picture.
- Increase transparency and accountability: Making mapping methodologies and source data more transparent could help increase accountability and allow for error-checking and public input. We believe that public feedback and challenge processes are essential to further refine the maps.
- Update maps more frequently: With the fast pace of broadband deployment, maps can quickly become outdated. More frequent data collection and updates could help keep pace with changes on the ground.
- Validate data: Allocating resources for the FCC or third parties to independently validate a sample of provider-reported data through audits or on-the-ground testing could improve data quality and keep ISPs honest in their reporting.
- Collaborate with states and localities: Leveraging mapping efforts already underway at state and local levels and collaborating to share data and methodologies could yield more accurate and detailed maps.
About This Study
BroadbandNow Research manually checked provider availability at 11 ISP web sites that offer online “check availability” tools. We checked at least one provider for 64,956 addresses from a dataset of more than 1 million addresses. In total, there were 113,686 provider-address combinations checked, of which a sample was re-checked for errors. Based on the results of the study, we estimate a 22.1 percent error rate for provider-address combinations across the U.S.
For addresses with multiple providers checked, 1.27 percent of the time none of the providers offered service. Many small and mid-sized providers do not offer online “check availability” tools and so could not be checked manually. Approximately one-third of the addresses in our sample did not have a local ISP alternative (according to the FCC). When we only assume that these addresses are unserved, the total unserved population in the US is more than 22 million.