The internet plays a vital role in modern everyday life. It enables our communication, access to information, and is crucial to the smooth functioning of business and the economy. According to the United Nations, Russia’s most recent invasion of Ukraine has already led to over $100 billion dollars in infrastructure damage. This destruction has reportedly led to internet outages, and even resulted in a Twitter exchange whereby Elon Musk agreed to supply Starlink Satellite internet to the country.
This report is our attempt to get a deeper understanding of how internet access and quality has been impacted by the invasion. To do that, we analyzed speed test for all data available from Measurement Lab’s NDT data set from February 1st through March 17th.
Here are the key metrics we looked at to evaluate internet quality, although we discuss the nuance and caveats of these metrics in the findings below:
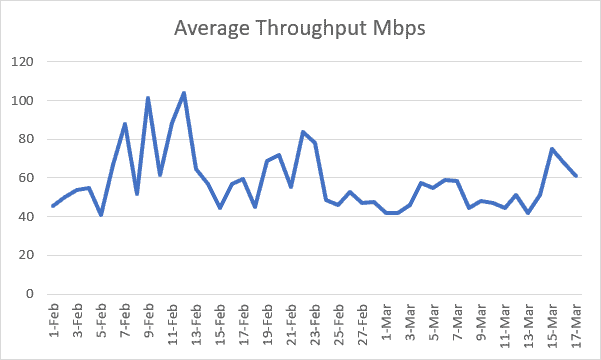
- Average Throughput Mbps: The average amount of data successfully transferred in megabits per second, or the speed of the connection.
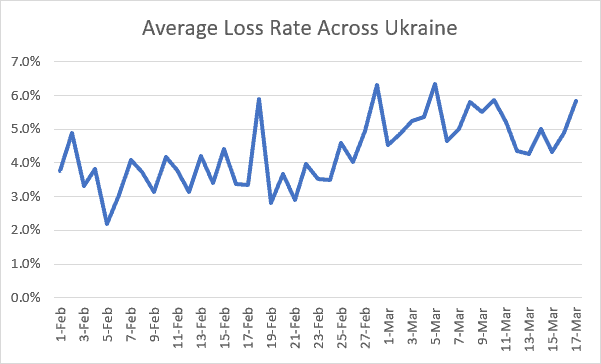
- Packet Loss Rate: The percentage of data “packets” that failed to transmit.
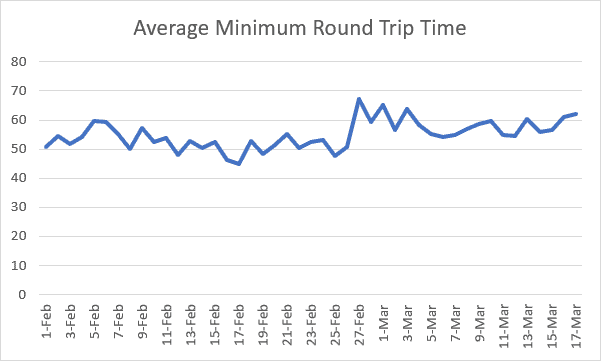
- Minimum Round-Trip Time: The lowest observed amount of time it takes to transfer data to a server and receive a response. This is like latency or ping, but it also includes the time to receive a response.
We also show data for certain regions and cities in Ukraine. As you’ll see below, cities like Mariupol have also gone days without any speed tests, suggesting to us that internet access is totally unavailable during that time.
Our Findings
The primary finding is that all metrics have deteriorated materially since the invasion began. On average, speeds decreased by 12.5 Mbps, packet loss rate increased by 37% from 3.7% to 5.1%, and minimum round-trip time increased by 5.3ms from 52.5ms to 57.8ms.
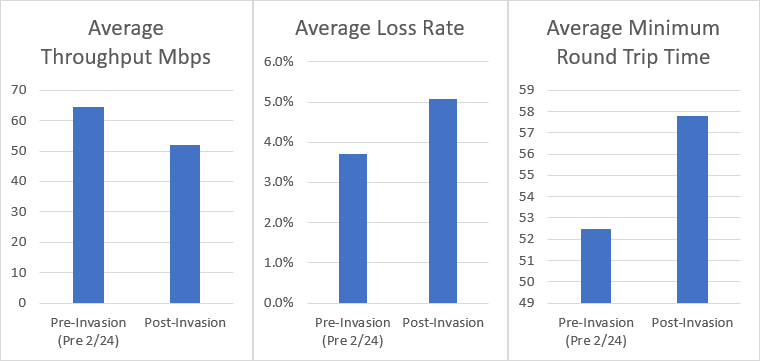
All three of these changes may seem relatively small, however the change in average loss rate crosses a significant threshold. A loss rate of over 2% is already an indicator of poor internet even prior to the most recent invasion, but error correcting codes can make up for lost packets so that for most users and most applications this may not have even been noticeable. Greater than 5% loss rate, however, is too high and could have significant impacts on usability. Additionally, the deterioration of all three metrics is part of a consistent pattern seen both in aggregate and regionally.
Here is a closer look at each of the metrics over time across Ukraine.
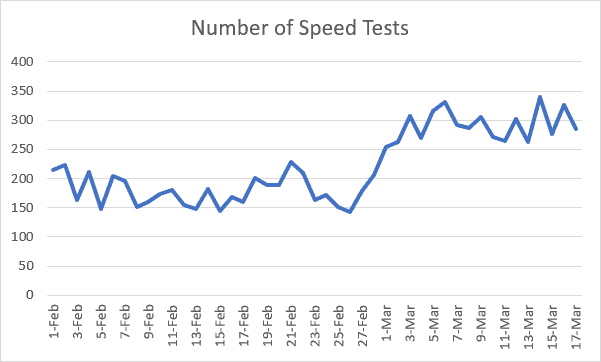
Another way of considering the impact is to look at the quantity of speed tests. We know that people are more likely to run a speed test when they are experiencing degradation of service. In the chart below, you can see a clear spike in speed tests after the invasion. When you consider that some (and likely many) parts of Ukraine experienced outages where people could not run a speed test, this spike is considered even more pronounced.
Regional findings
To get a better idea of how these changes are happening locally, we looked at our three metrics in 8 different cities across Ukraine.
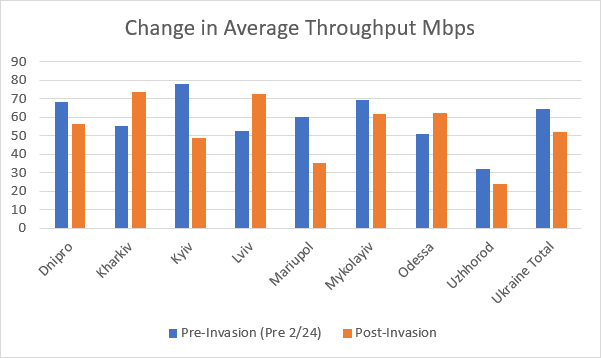
Average Throughput Mbps decreased after the invasion in 5 out of 8 cities:
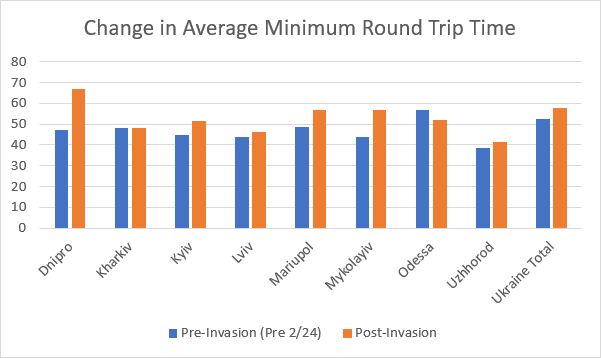
Average minimum round-trip time increased in 6 out of 8 cities, and remained the same in 1:
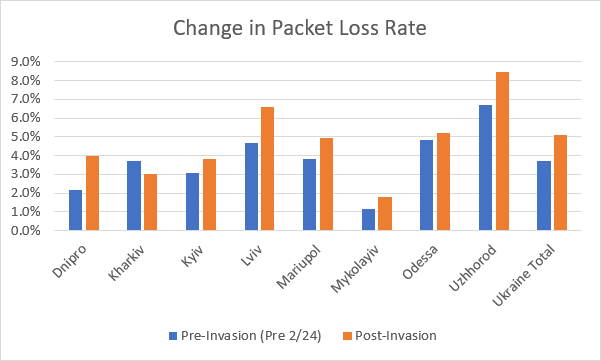
And packet loss rate increased in 7 out of 8 cities:
The following table summarizes the findings:
| Avg Throughput Mbps | Avg Min Round-Trip Time | Avg Packet Loss Rate | |
|---|---|---|---|
| Dnipro | Worse | Worse | Worse |
| Kharkiv | Better | Same | Better |
| Kyiv | Worse | Worse | Worse |
| Lviv | Better | Worse | Worse |
| Mariupol | Worse | Worse | Worse |
| Mykolayiv | Worse | Worse | Worse |
| Odessa | Better | Better | Worse |
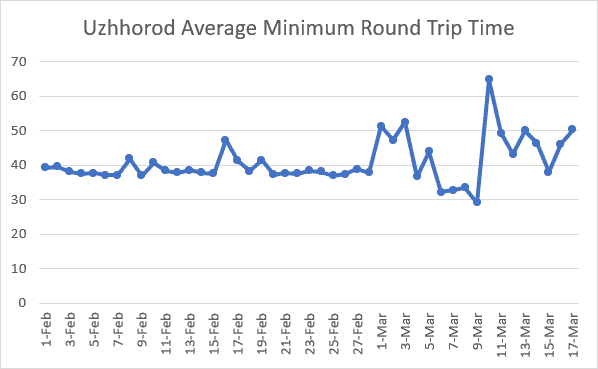
| Uzhhorod | Worse | Worse | Worse |
Finally, we wanted to take an even closer look at a few of the cities to understand the local effects over time.
Here are each of the three metrics we looked at over time for the capital city Kyiv.
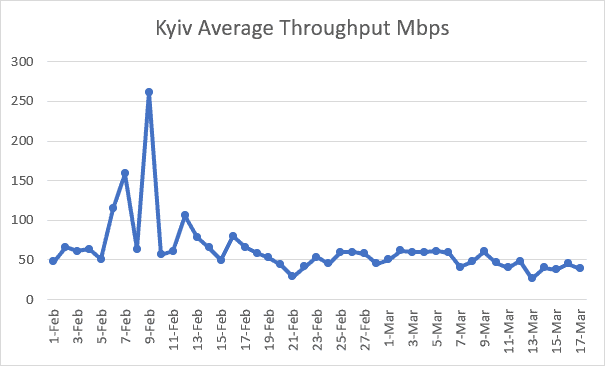
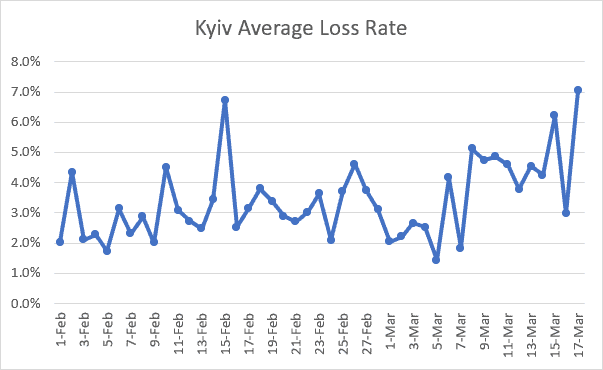
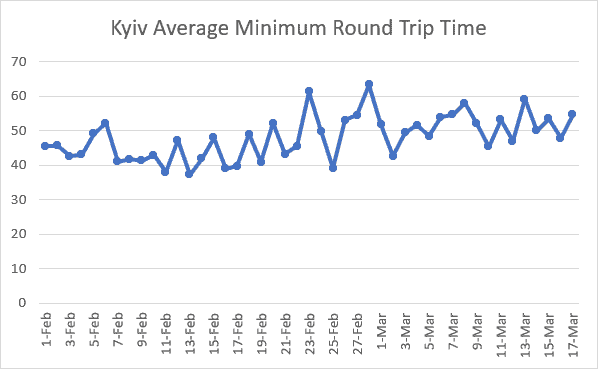
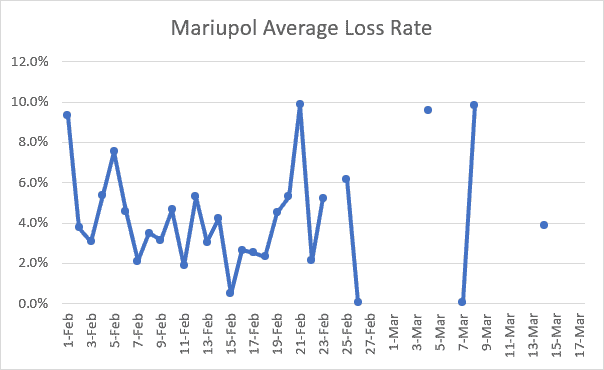
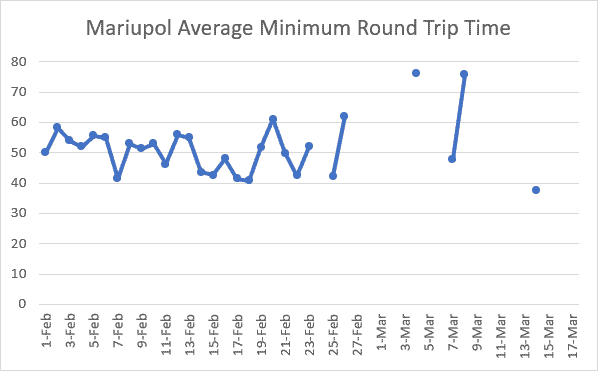
Here are the graphs for the coastal city of Mariupol, which has been surrounded by Russian forces and is experiencing some of the heaviest bombing in the country. The city has been virtually completely without internet since the start of the February 24th invasion.
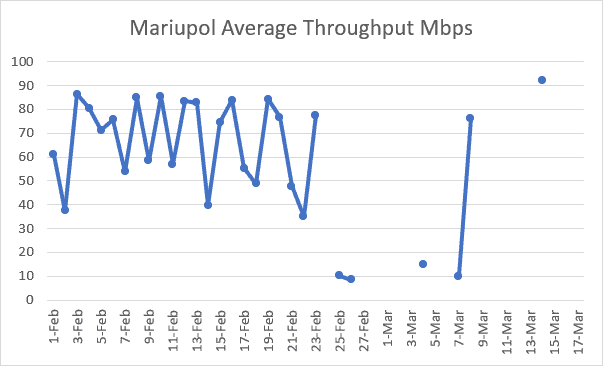
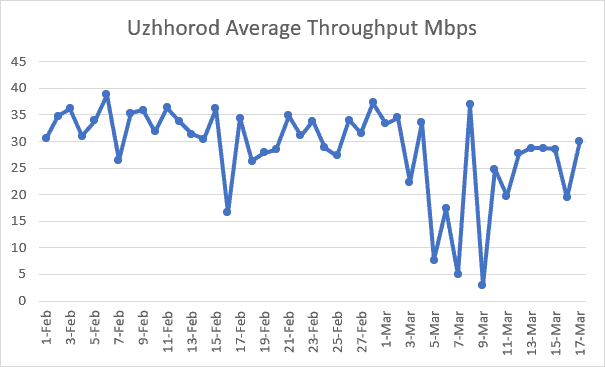
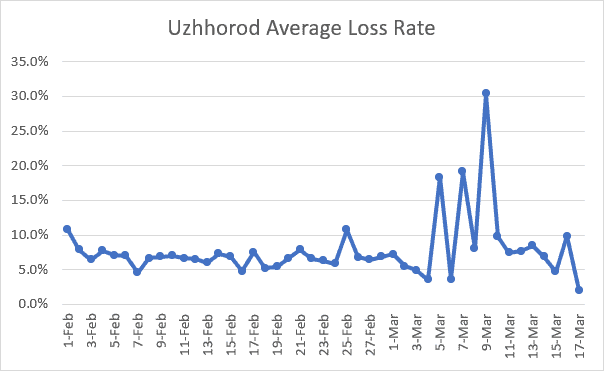
Finally, here are the graphs for the city of Uzhhorod. Uzhhorod is in the far West of the country and is far away from the invading forces. Despite that fact, however, starting at around March 3rd, the city has seen severe disruptions in its internet service.
Citations:
- Pingman Tools, “What’s ‘Normal’ for Latency and Packet Loss?”, https://pingman.com/kb/42
- The M-Lab NDT Data Set, (2022-02-01 – 2022-03-17) https://measurementlab.net/tests/ndt
- United Nations, “Ukraine war: $100 billion in infrastructure damage, and counting”, https://news.un.org/en/story/2022/03/1114022