
This is our seventh weekly report examining internet performance across the top 200 most populous cities in the U.S., alongside data from hundreds of rural communities. In conjunction with this release, we have also published a comprehensive look at networks across the globe and how they have held up over the past two months as the coronavirus has continued to spread.
KEY FINDINGS
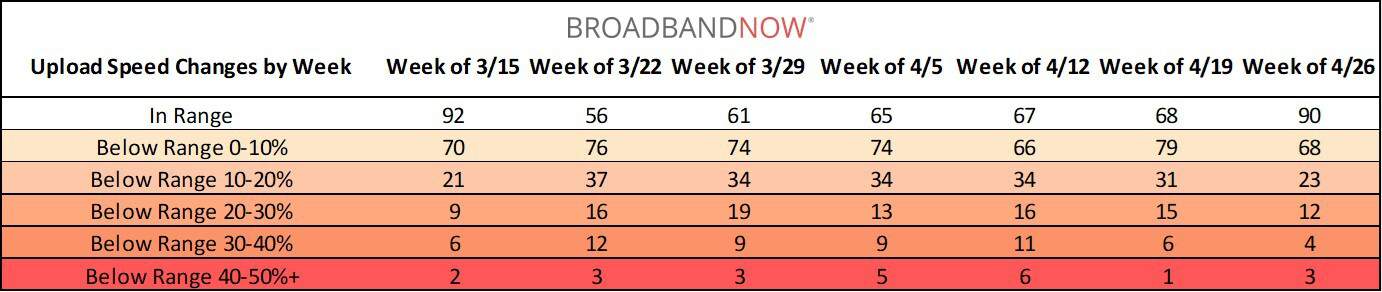
- 42 cities (21% of the top 200) recorded median upload speed decreases of 10% or greater out of range this week compared to prior weeks in 2020, continuing a downward slide from last week’s 53 cities, or 26.5%.
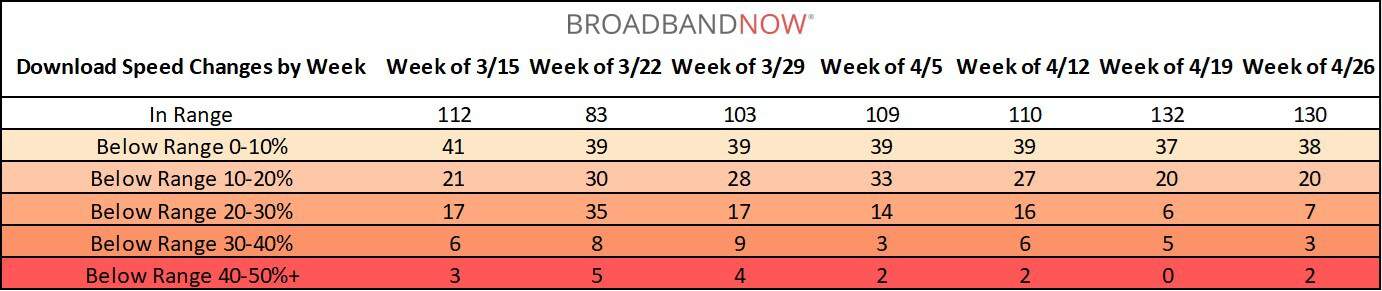
- 32 cities (16%) are now reporting median download speeds 10% or greater below range, a very minor increase compared to last week’s 31 (15.5%).
- Median upload and download speeds in rural communities across the U.S. have continued to improve slightly for the second week in a row.
- Three cities experienced upload speeds that fell greater than 40% out of range this week; Baltimore, Maryland, New Orleans, Louisiana, and Oxnard, California. Last week, only one city (New Orleans) fell into this category.
- While no cities in the U.S. experienced median download speeds 40% or greater out of range last week, now both Louisville, Kentucky and Evansville, Indiana fall into this category for the week.
RURAL UPDATES
Rural communities continue to see mild increases in average download and upload speeds this week. The line chart below illustrates average speeds over the past 17 calendar weeks:
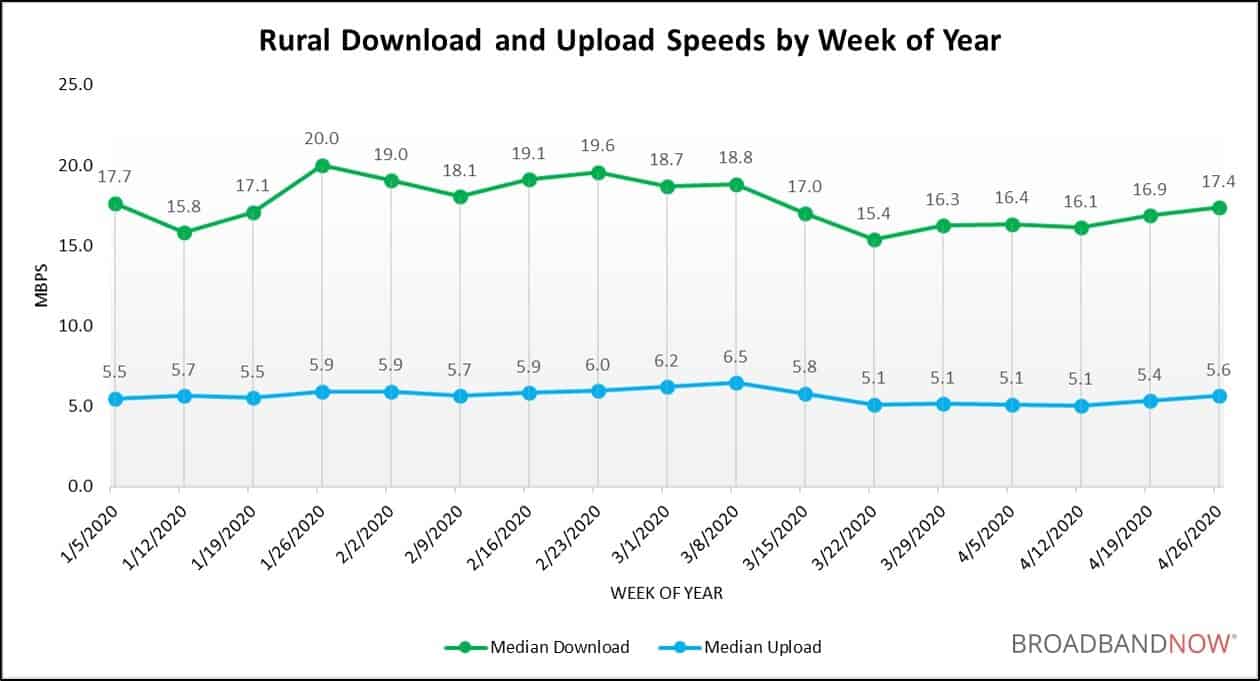
The data above is collected from aggregated speed test information taken from zip codes in counties marked as non-metropolitan (Micropolitan and Noncore) under the CDC’s Urban–Rural Classification Scheme. Results are displayed in aggregate due to the limited availability of speed test data in rural areas.
MEDIAN INTERNET SPEEDS – 200 MOST POPULOUS U.S. CITIES
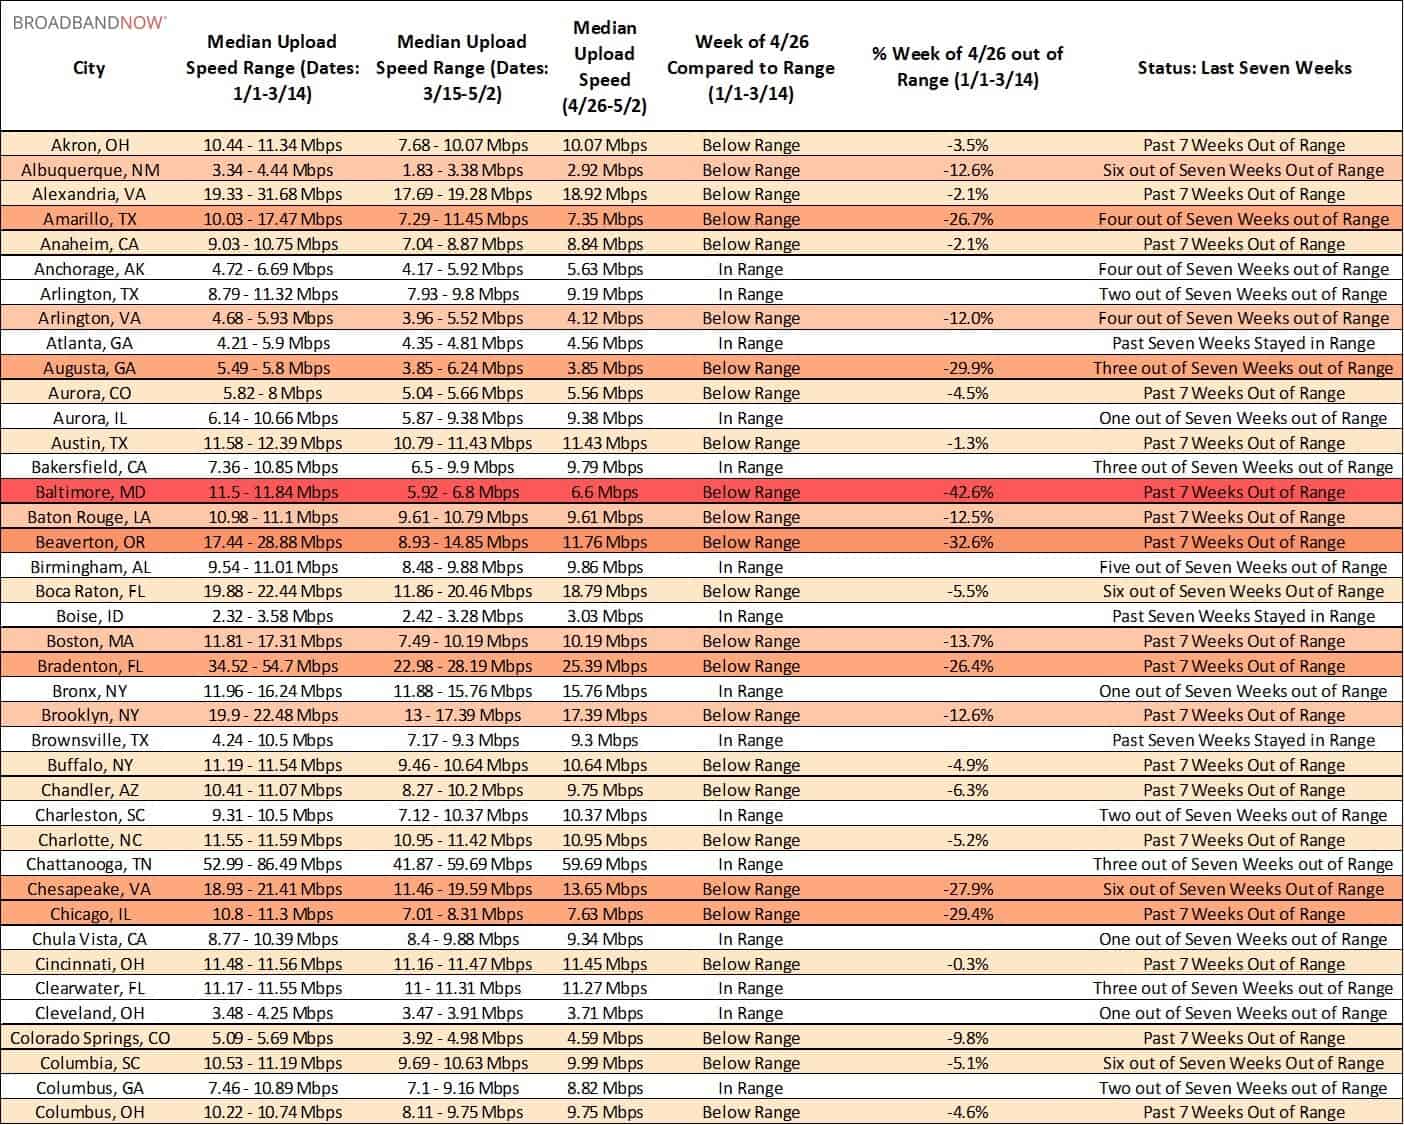
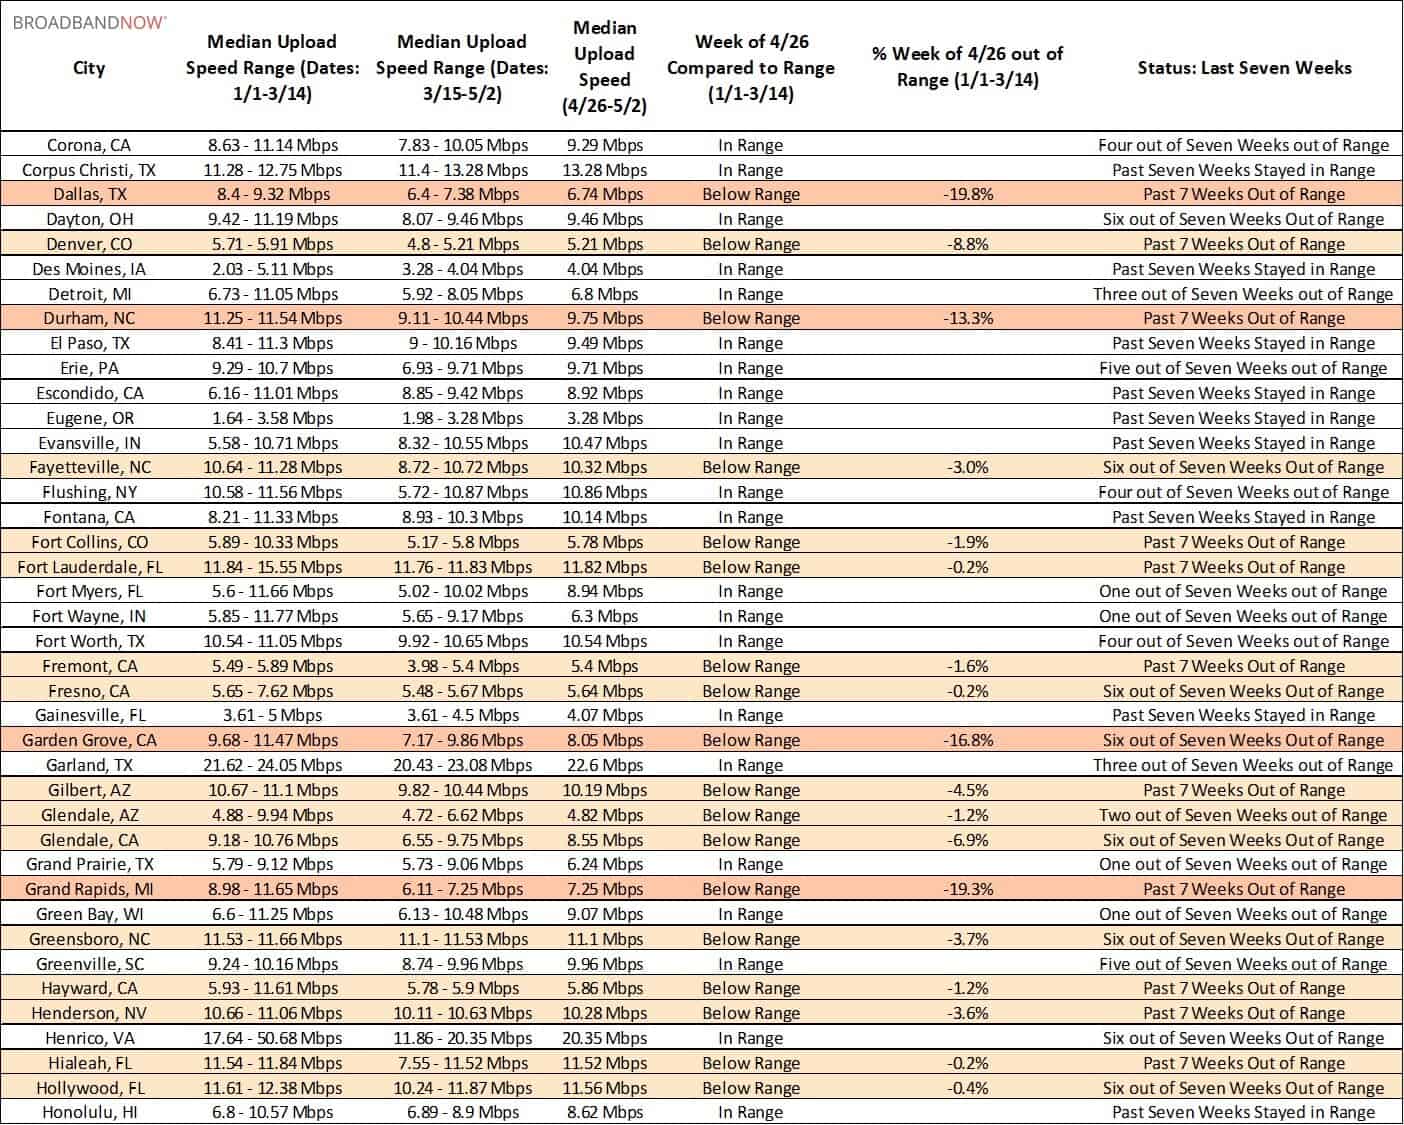
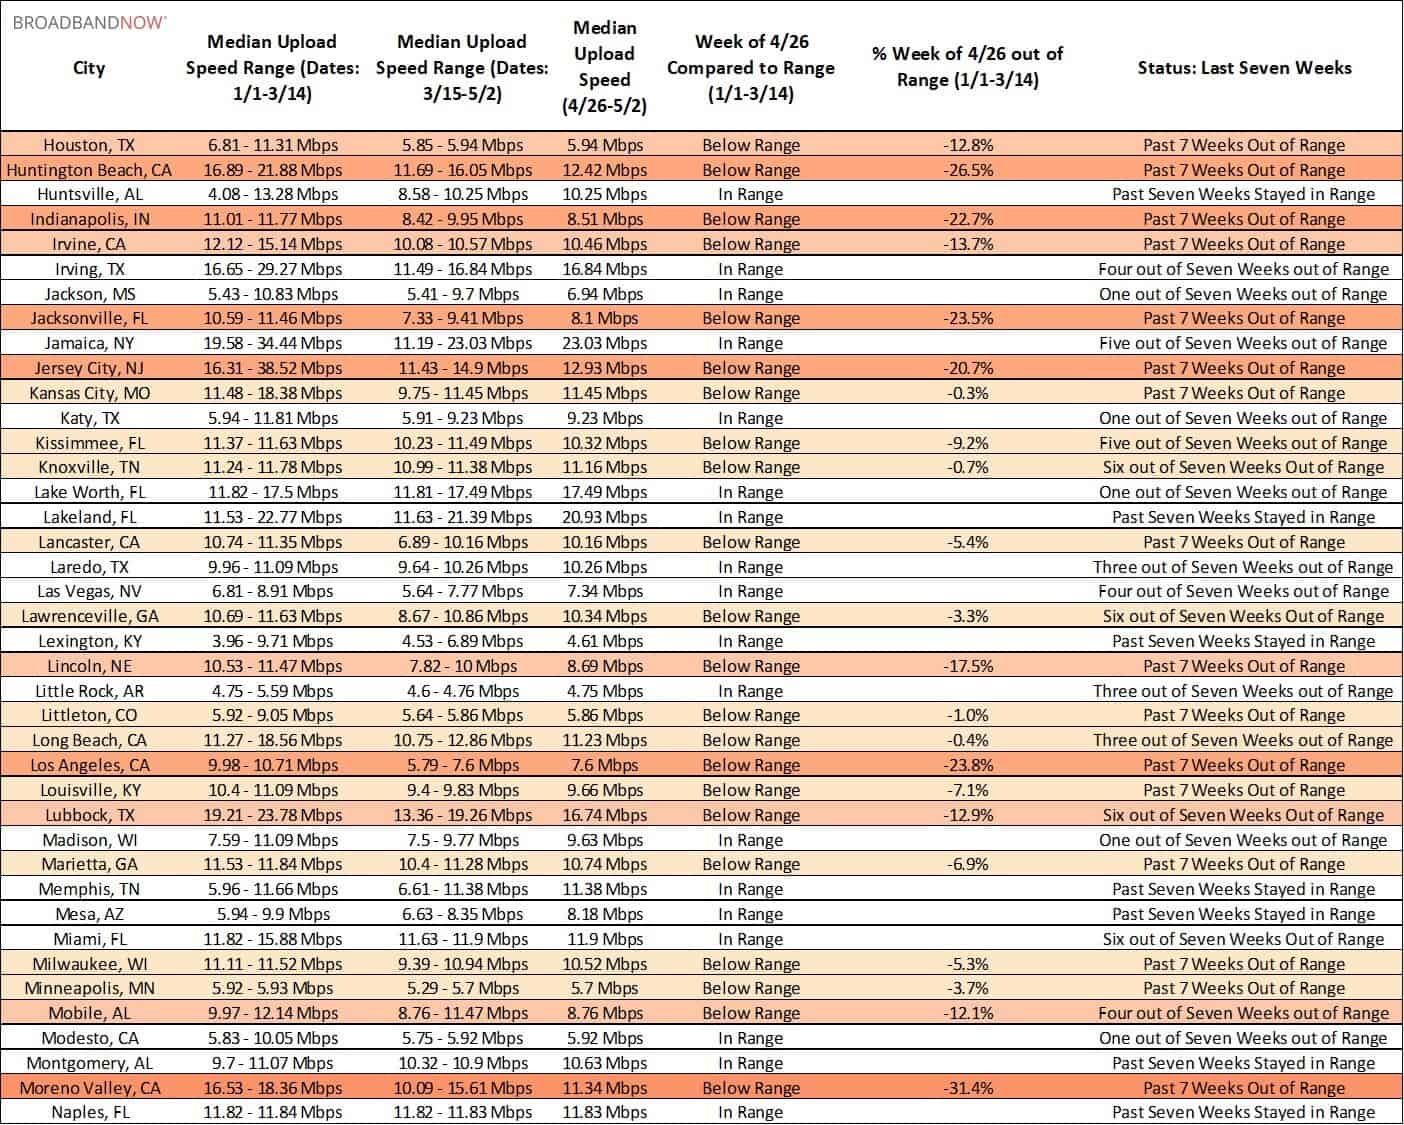
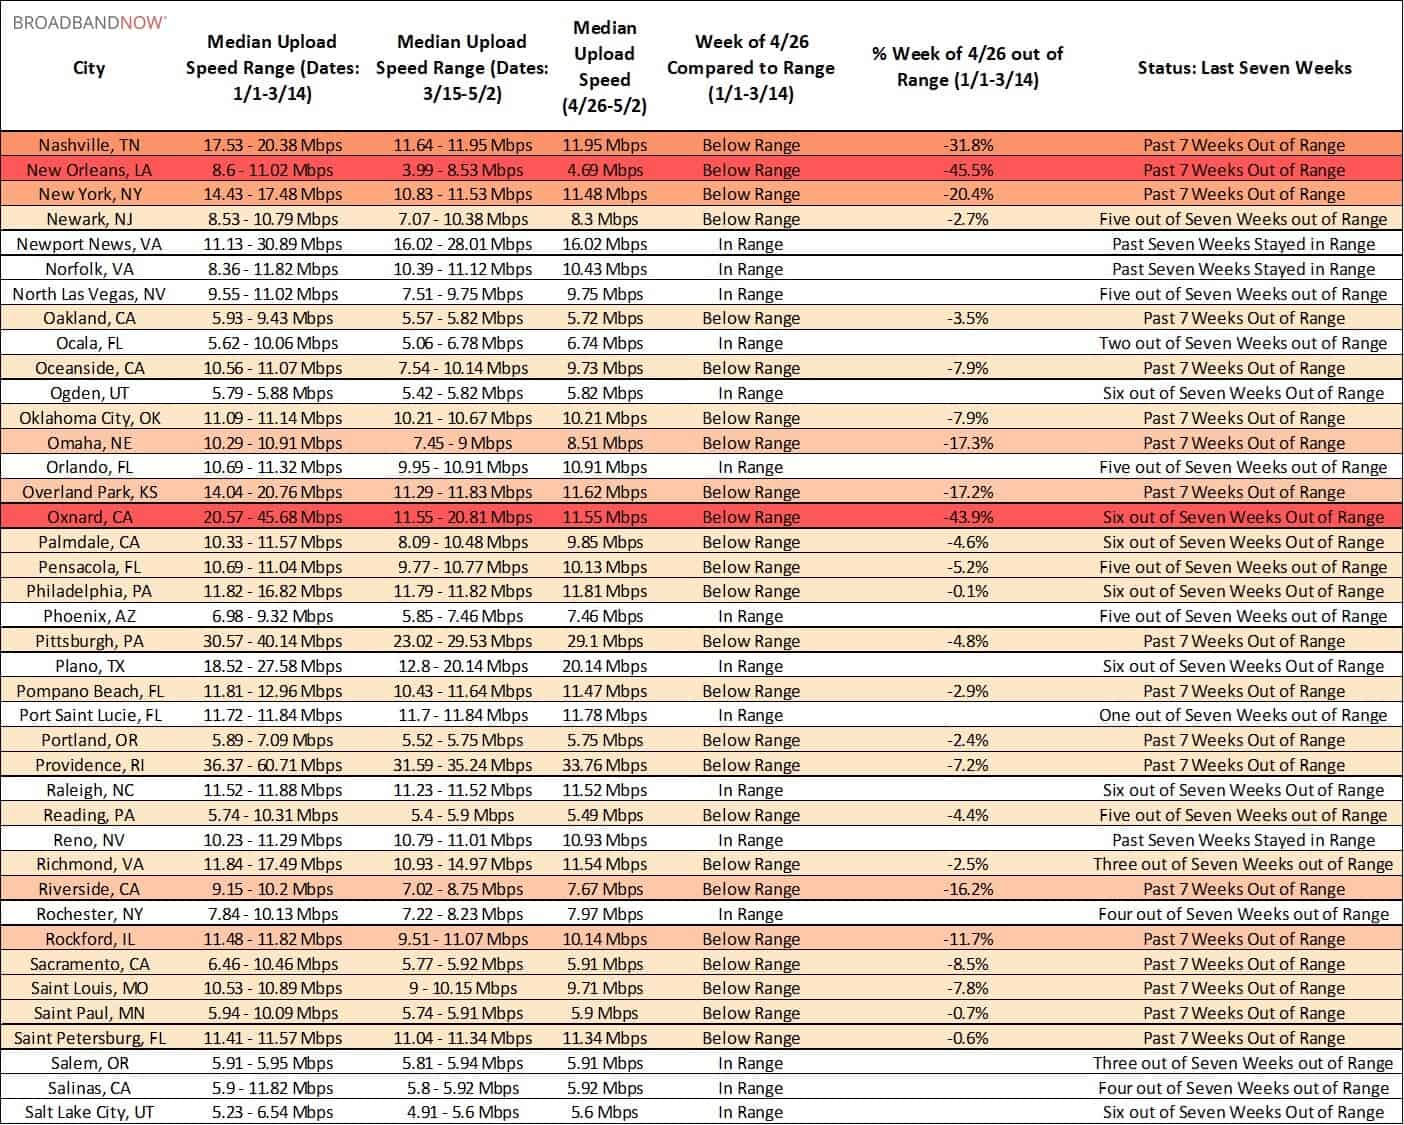
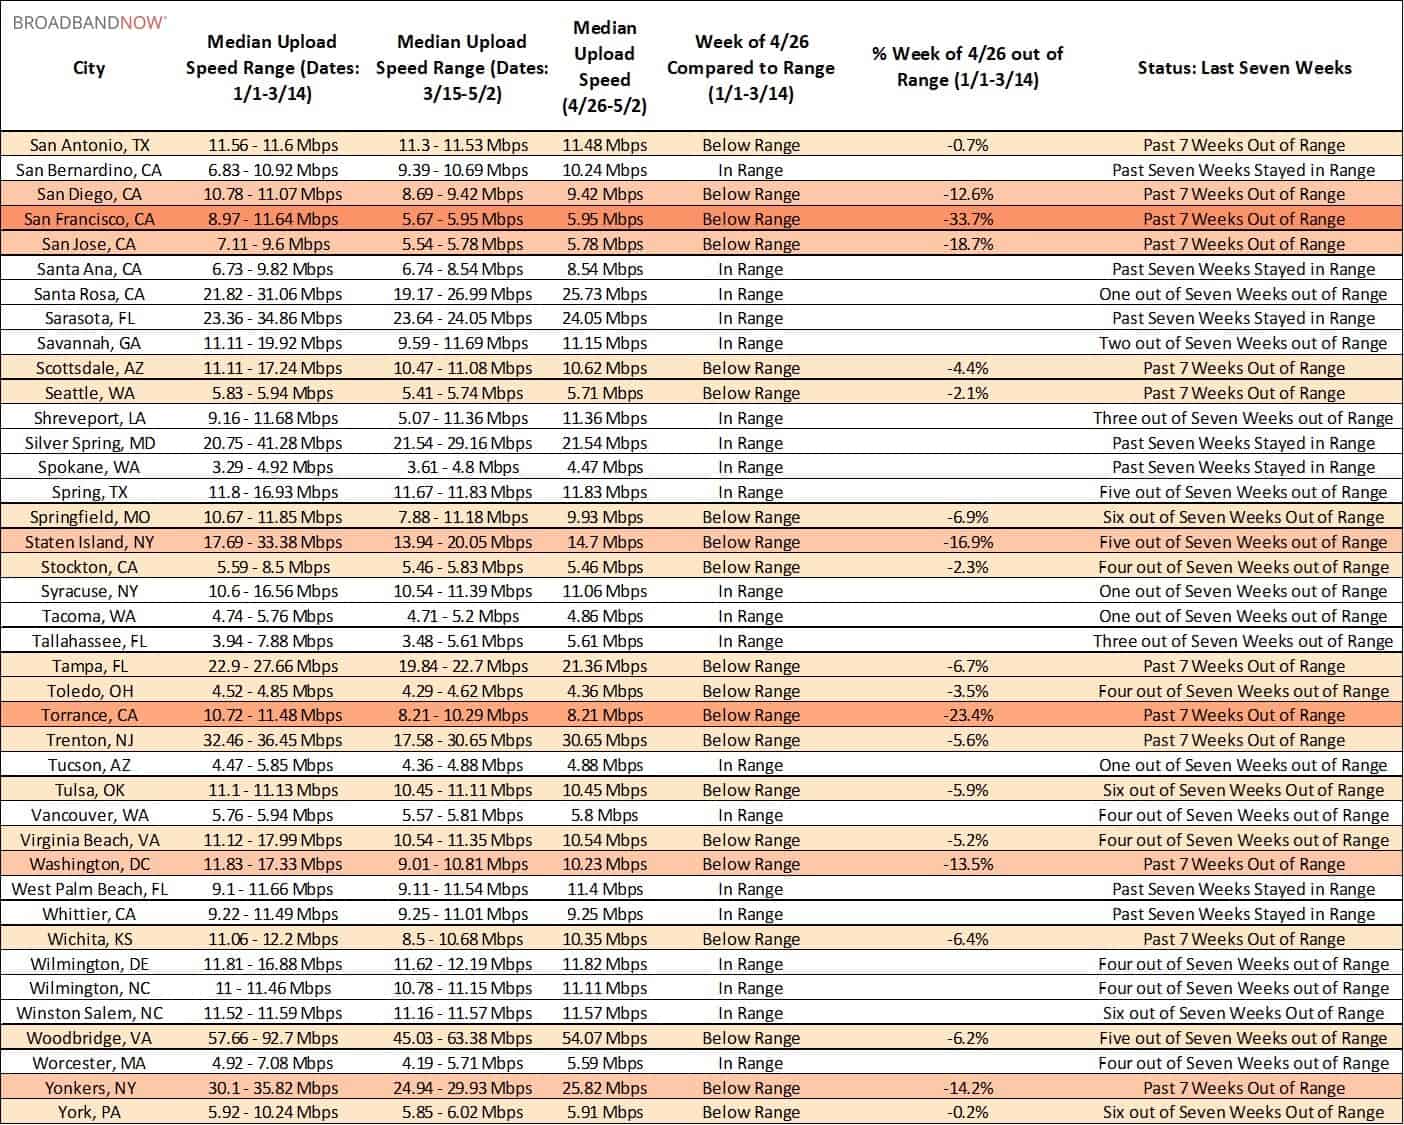
The tables below show both upload and download speed performance over the past seven weeks in the 200 most populous cities in the U.S. If a city is “in range,” it means that its current median internet speeds are comparable to the range of speeds recorded over the first 11 weeks in 2020.
Conflicting results highlight the complex and ever-shifting nature of internet performance across America, with several new cities experiencing more significant upload and download speed disruptions this week than the last. At the same time, more than 20 cities have now risen to be in range of previous weeks in 2020 in terms of average upload speeds.
Are you a journalist or researcher writing about this topic?
Contact us and we'll connect you with a broadband market expert on our team who can provide insights and data to support your work.
UPLOAD SPEEDS OVER TIME
158 cities (79% of the top 200) reported average upload speeds less than 10% out of range this week, up slightly again from last week’s 147 cities (73.5%).
Despite this, three cities reported more significant average upload speed decreases this week compared to last – Baltimore, Maryland, New Orleans, Louisiana, and Oxnard, California. Each of these cities has recorded similarly severe disruptions multiple times over the past month.
The tables below show upload speeds comparing the past seven weeks to the weeks of 1/1 to 3/14 for the top 200 U.S. cities by population, in alphabetical order.
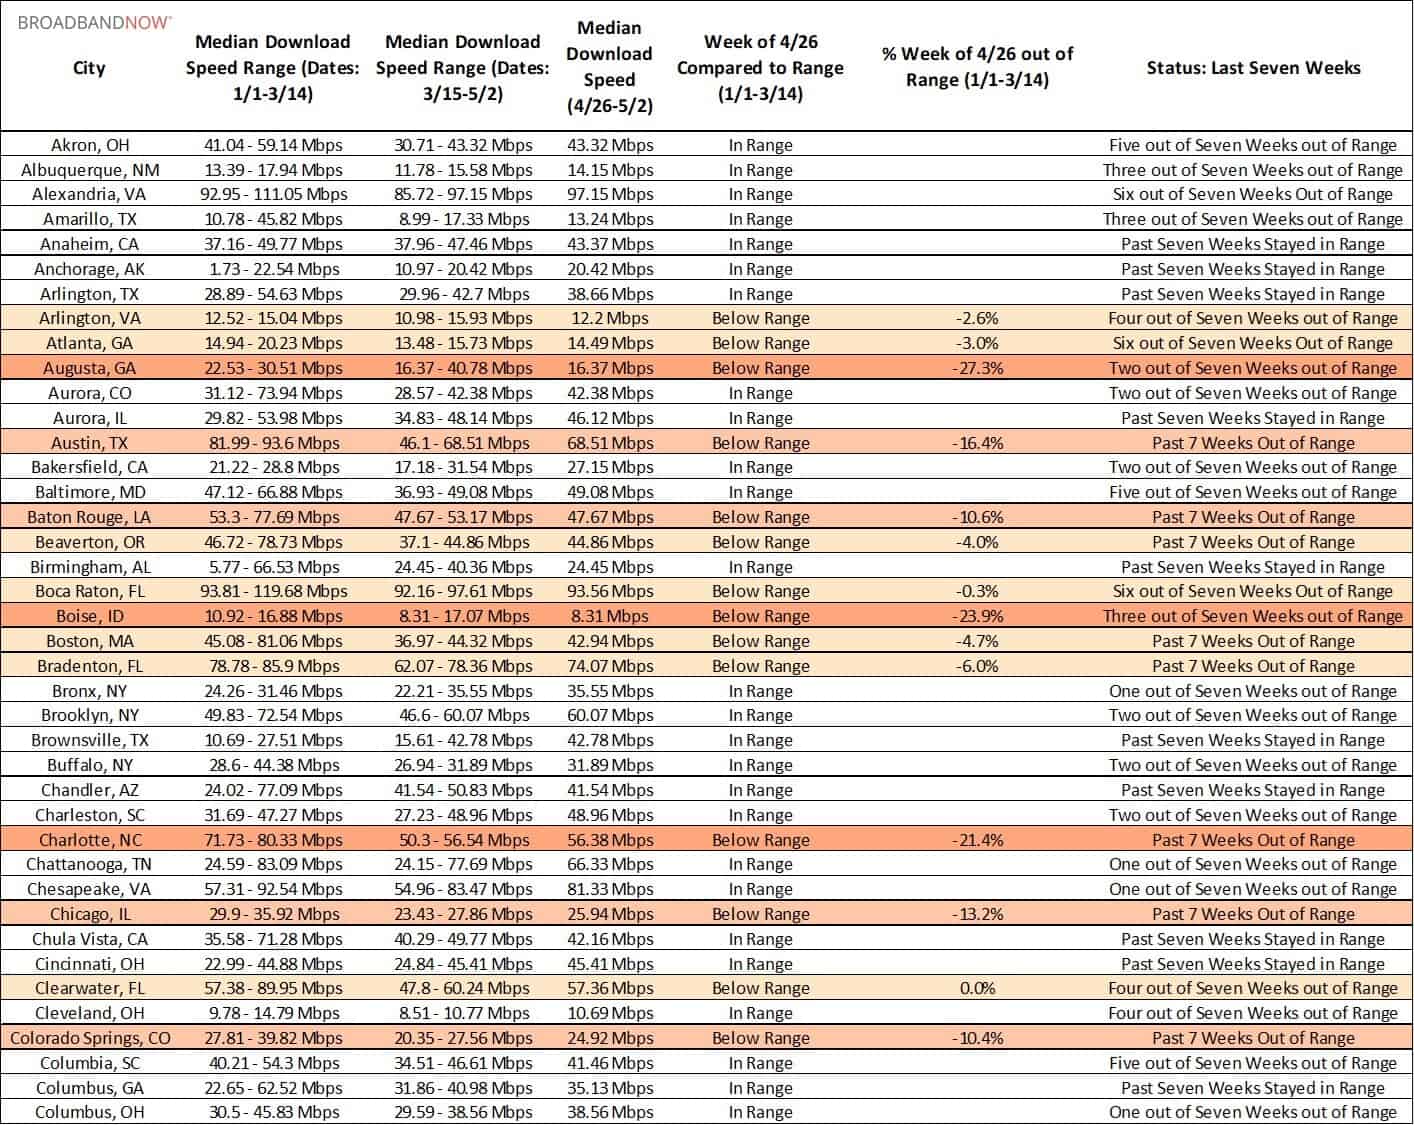
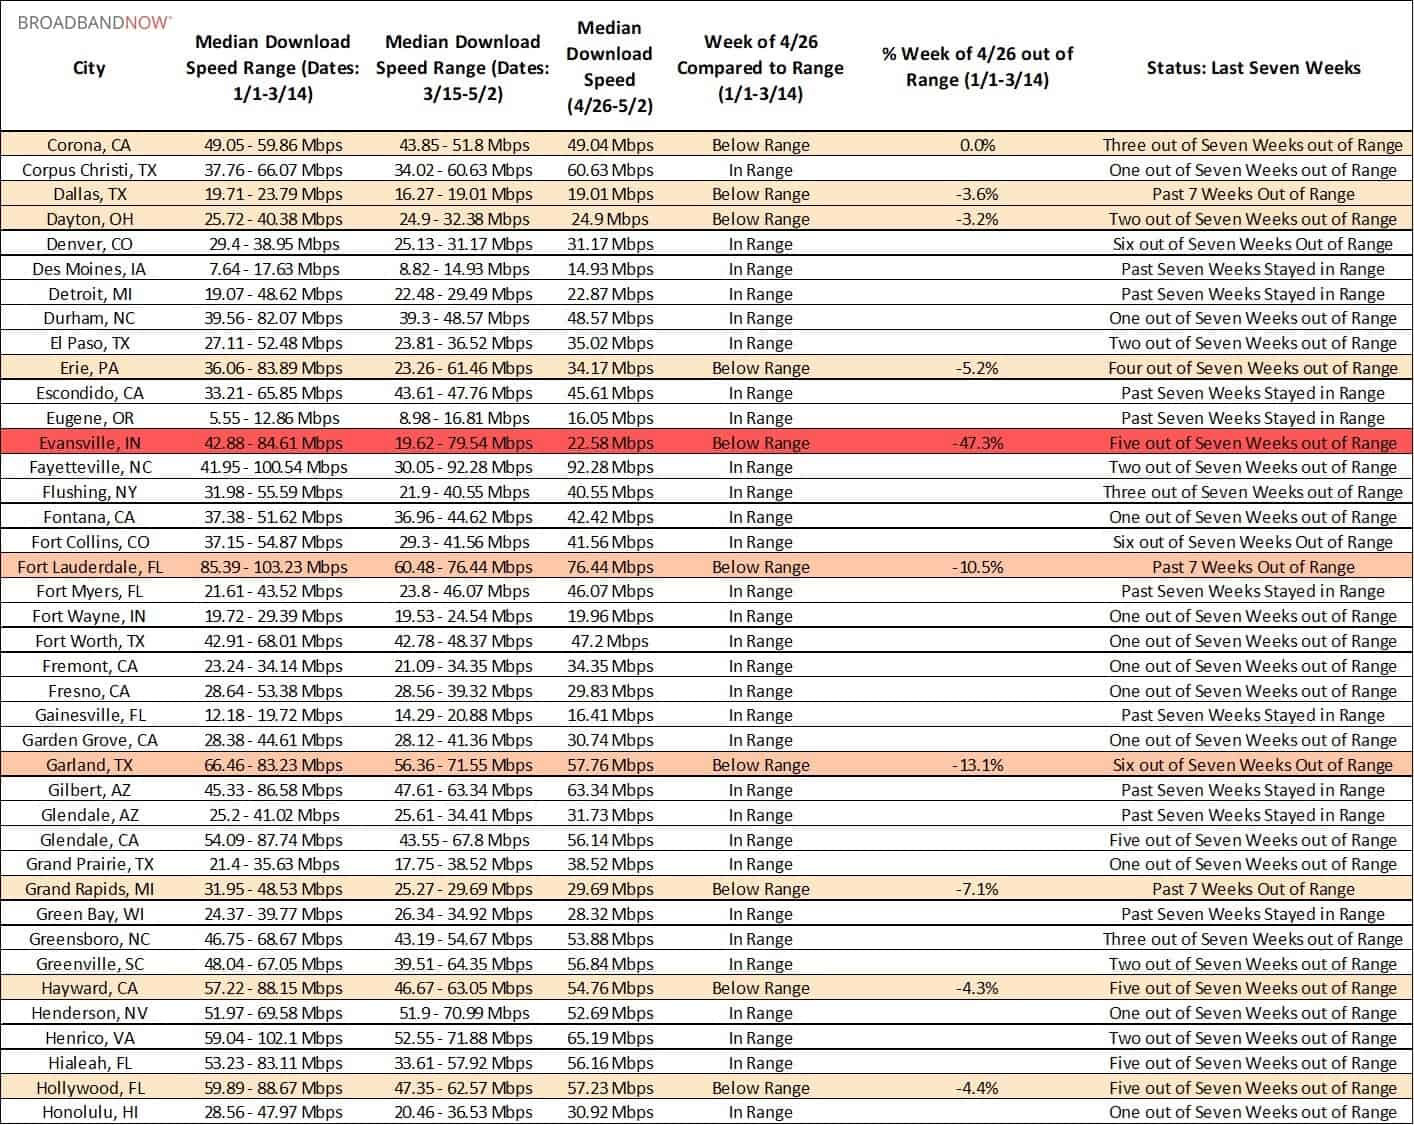
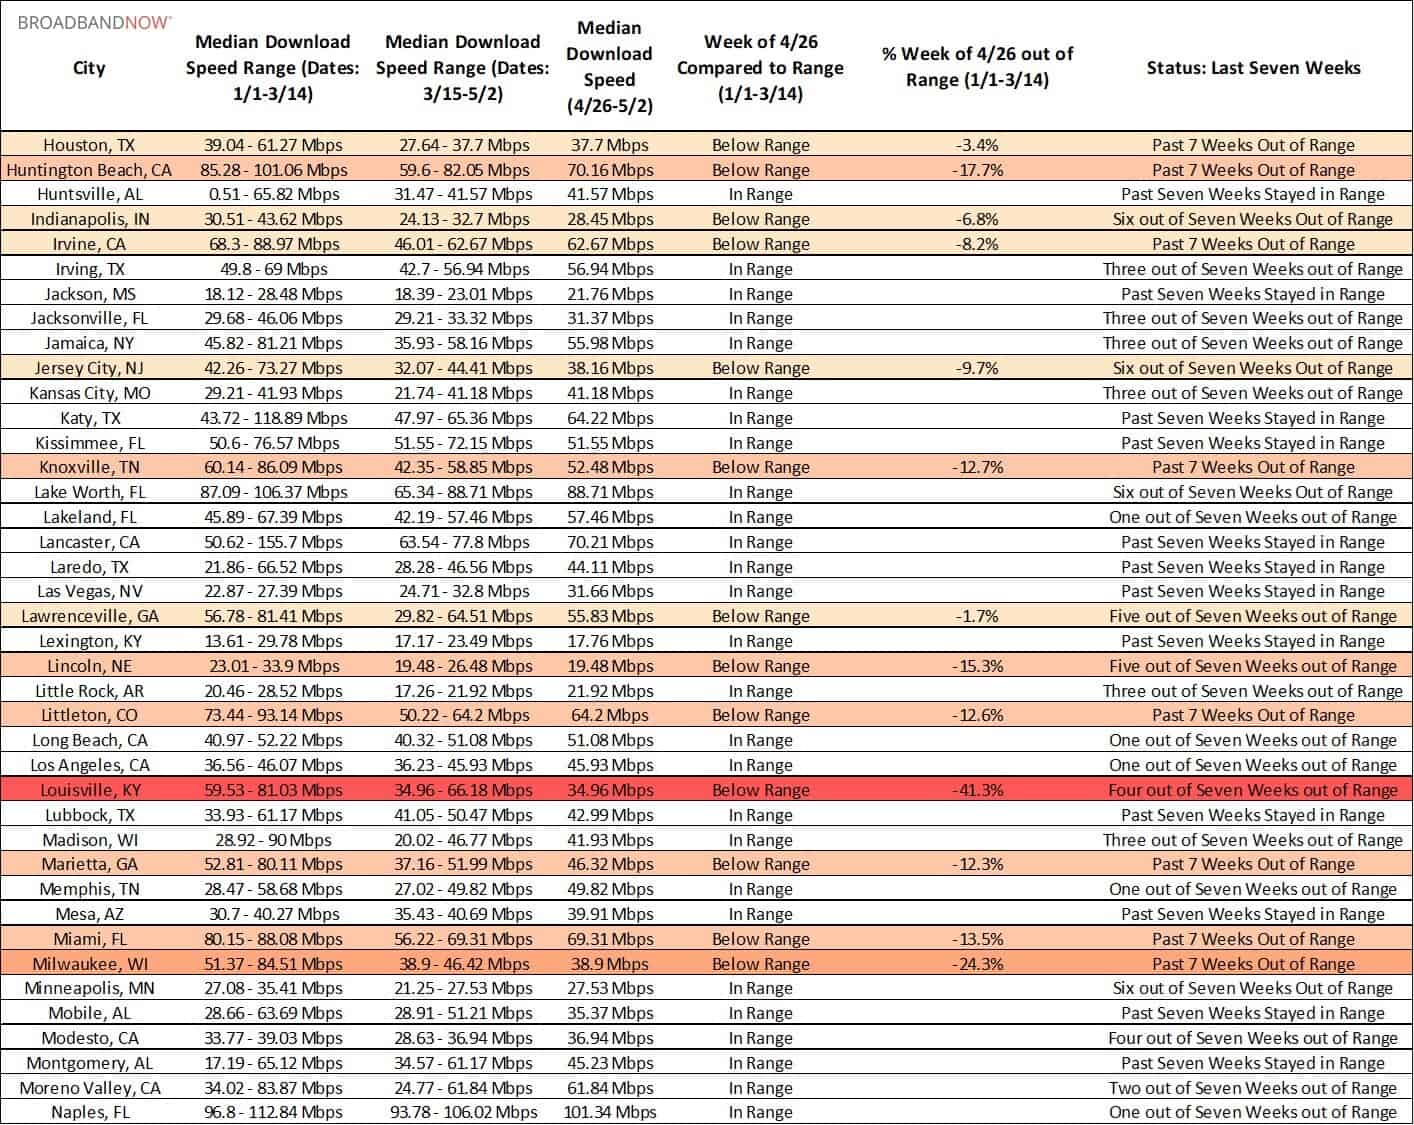
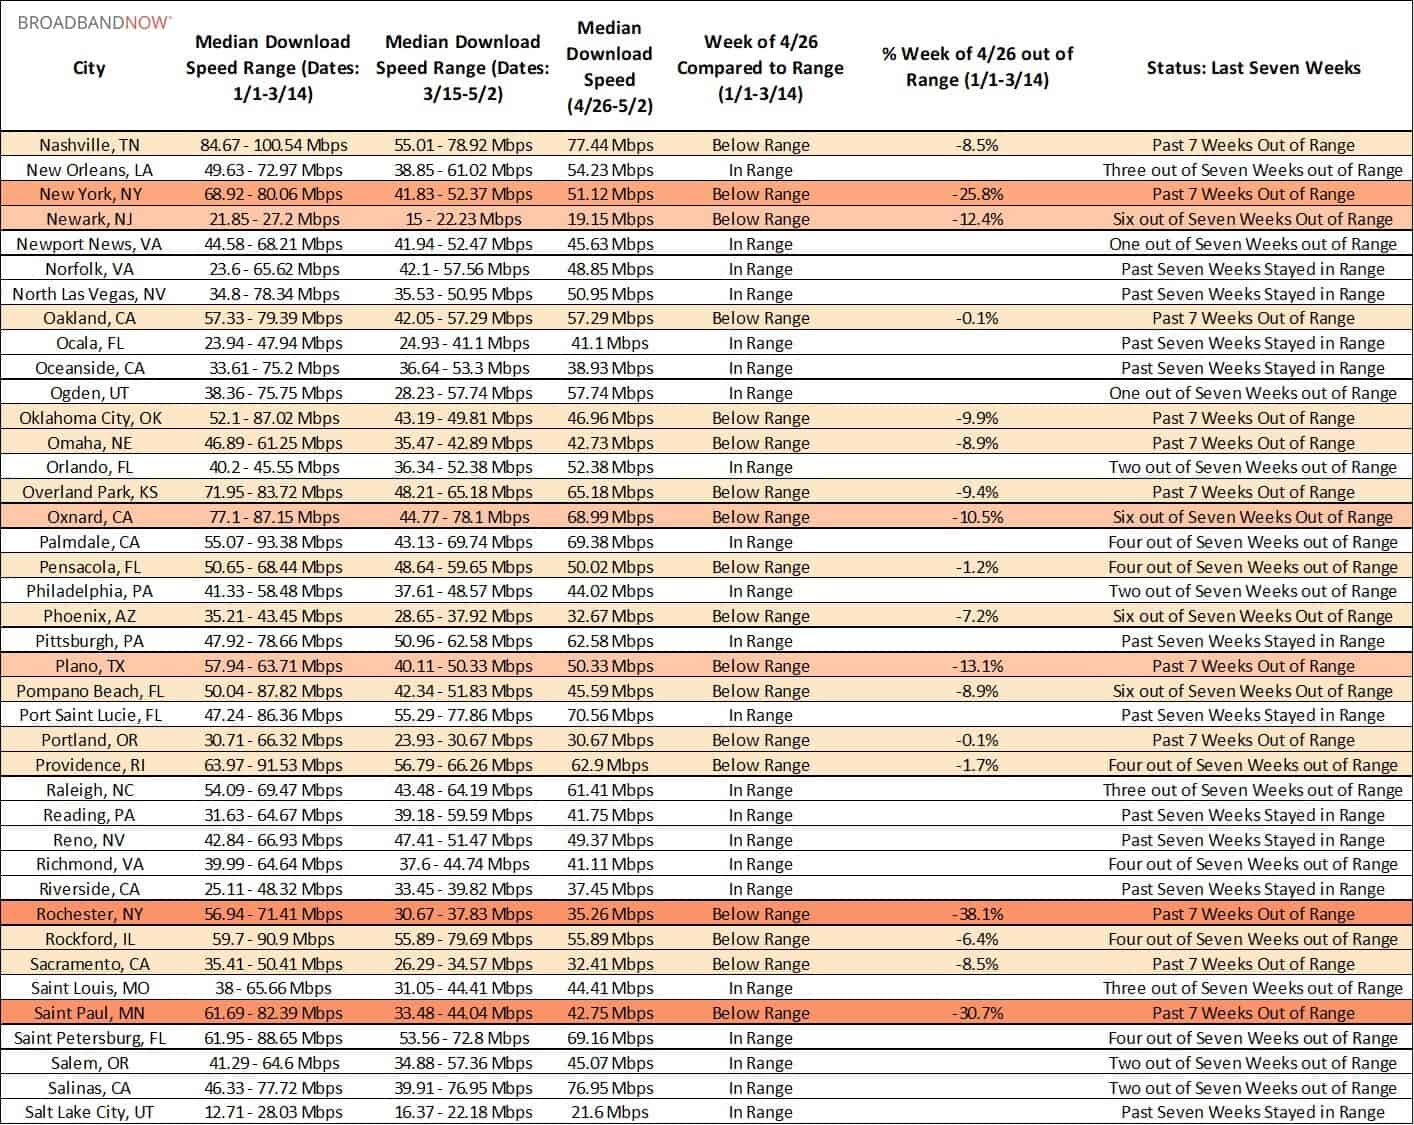
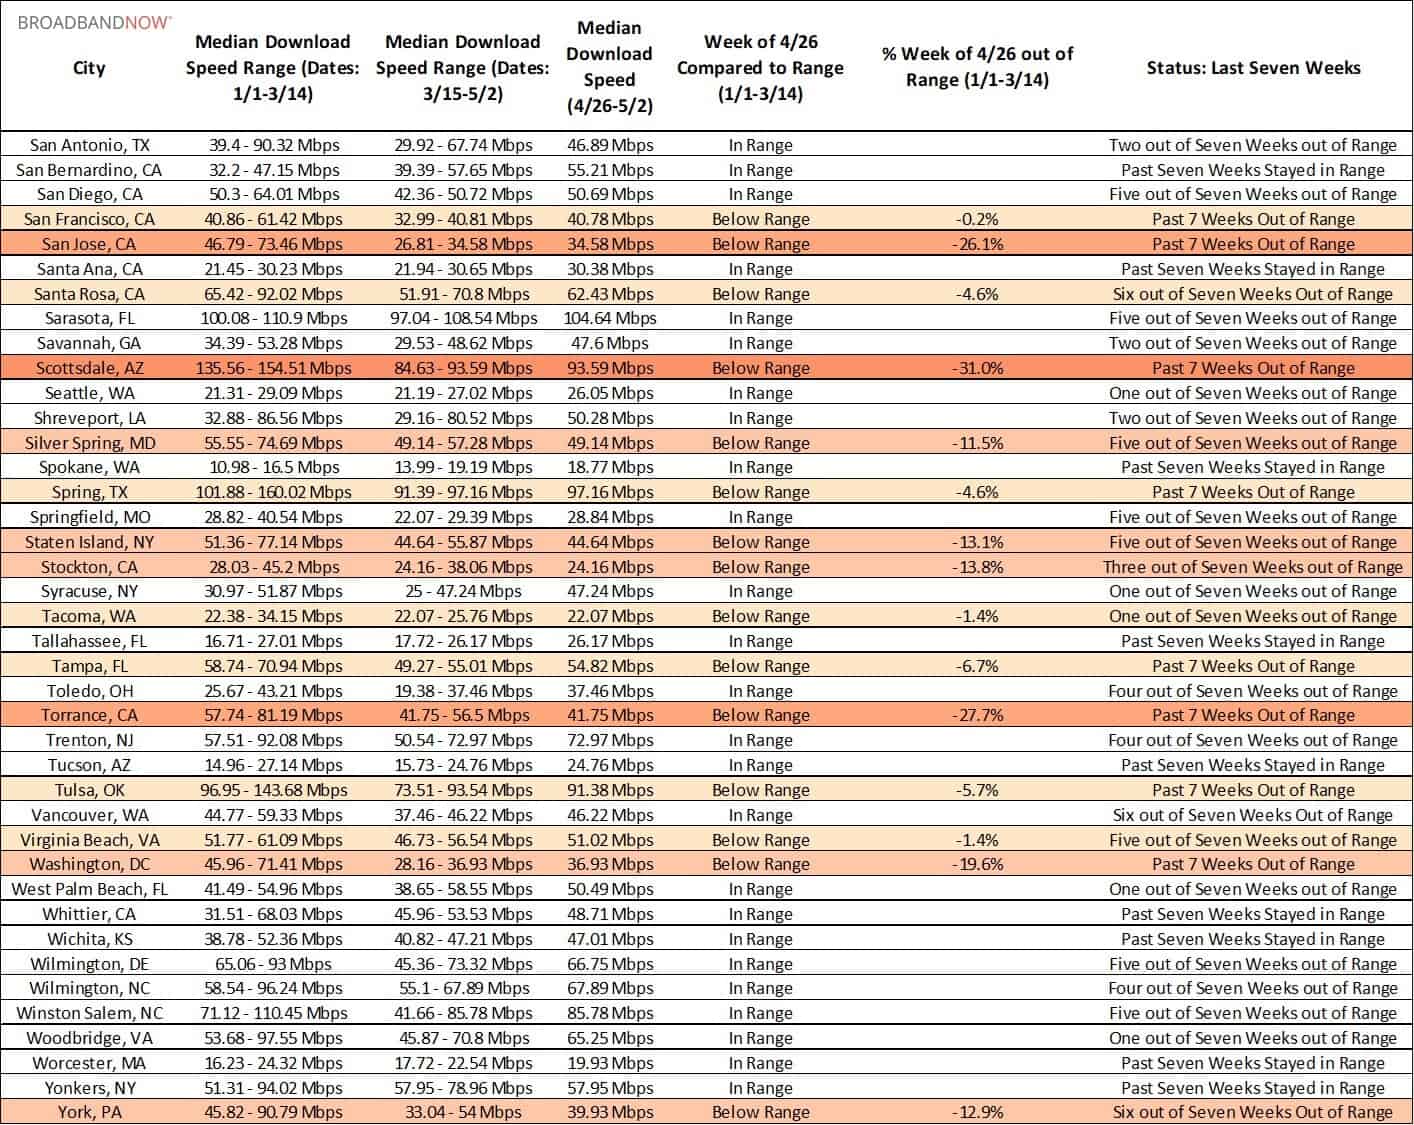
DOWNLOAD SPEEDS OVER TIME
This week, average download speeds have been less than 10% below range in 168 (84%) of the top 200 most populous cities. That is one fewer than last week’s total of 169 cities.
Last week, there were no cities reporting download speeds that fell more than 40% out of range of prior weeks in 2020. That changed this week, with Evansville, Indiana once again dipping below range by 47.3%, alongside Louisville, Kentucky at 41.3% below range.
The tables below show download speeds comparing the past seven weeks to the weeks of 1/1 to 3/14 for the top 200 U.S. cities by population, in alphabetical order.
Prior Reports
This report is the most recent in a series of reports looking into the stability of American internet networks amid the coronavirus pandemic. You can read prior weeks’ reports below:
- Internet Speed Analysis: Top 200 Cities, March 15th – 21st
- Internet Speed Analysis: Rural, Top 200 Cities March 22nd – 28th
- Internet Speed Analysis: Rural, Top 200 Cities March 29th – April 4th
- Internet Speed Analysis: Rural, Top 200 Cities April 5th – 11th
- Internet Speed Analysis: Rural, Top 200 Cities April 12th – 18th
- Internet Speed Analysis: Rural, Top 200 Cities April 19th – 25th
About The Data
We analyzed raw speed test data from M-Lab for the top 200 cities by population in the U.S. in order to determine how well ISP’s are coping with this unprecedented surge in demand. Data was taken from the past 17 calendar weeks, and we calculated median download speeds and ranges for every city listed based on this information.
We also looked at the rural areas as defined by the CDC’s Urban–Rural Classification Scheme as non-metropolitan areas and measured their speeds, in aggregate, by week. The M-Lab’s data we used includes all users running speed tests on various websites, and does not separate by device type or ISP.