
Networks are continuing to recover this week, but users are still facing disruptions in hundreds of U.S. cities
Over the past month, home internet connections around the country have been put to the test as tens of millions of Americans have been forced to stay home.
Our team has tracked internet performance in urban and rural communities across the U.S. in an effort to better understand how this widespread shift has affected the networks that workers and students are increasingly reliant on to stay productive.
In early to mid March, networks seemed to be straining against the demand, showing signs of degradation across dozens of cities and towns. However, for the past two weeks, internet download and upload performance has been on the rise.
Key Findings
- Internet performance across the top 200 cities continued to improve over the past week; 91 (45.5%) cities have seen download speed decreases, down from 97 (48.5%) last week. 135 cities (67.5%) have experienced upload speed decreases, which is once again down from last week’s total of 139 (69%).
- Median rural download and upload speeds recorded little change from last week, remaining below where they were in earlier months of 2020.
- Five cities have recorded upload speed decreases of greater than 40% out of range this week, including Baltimore, Maryland, Beaverton, Oregon, Jamaica, New York, Oxnard, California, and Shreveport, Louisiana.
- Only two cities have experienced significant download speed decreases of greater than 40% out of range this week: Evansville, Indiana and Saint Paul, Minnesota.
Rural Updates
As with prior weeks, we continue to monitor internet performance in rural communities all over the country. The results below represent aggregated speed test information taken from zip codes in counties marked as non-metropolitan (Micropolitan and Noncore) under the CDC’s Urban–Rural Classification Scheme. Results are displayed in aggregate due to the limited availability of speed test data in rural areas.
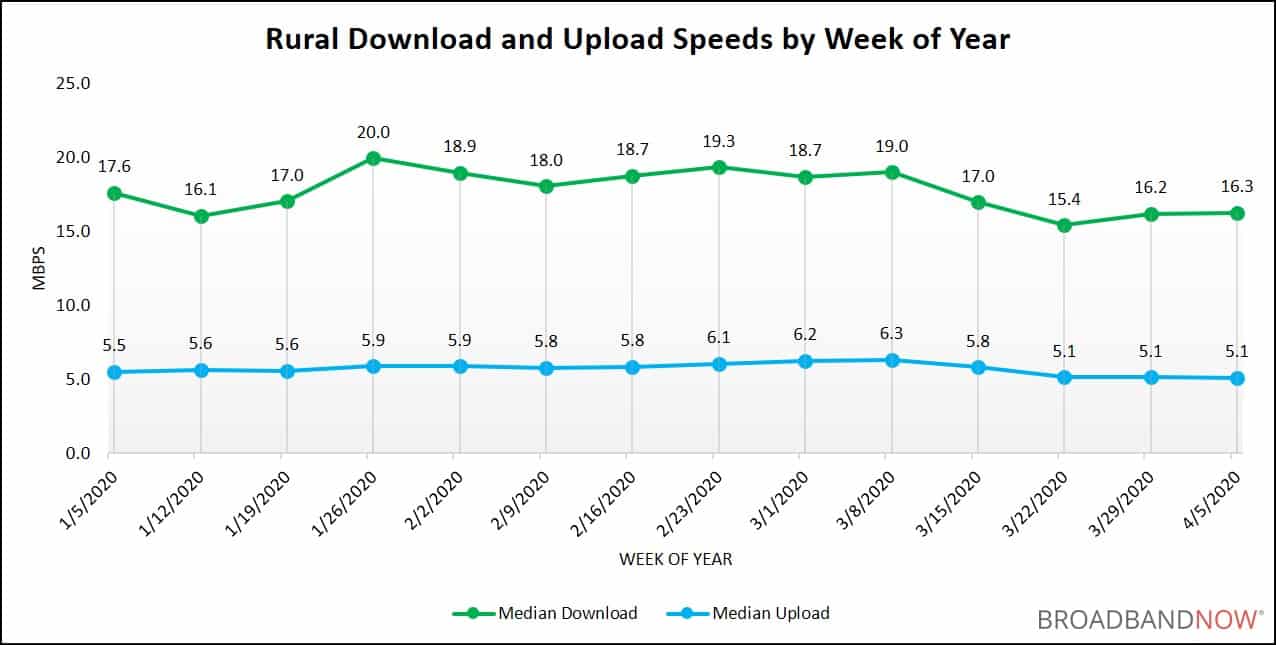
The following graph illustrates both download and upload speeds over the past 14 calendar weeks. Little has changed from last week, with both download and upload performance holding relatively steady at 16.3 Mbps and 5.1 Mbps, respectively.
Median Internet Speeds – 200 Most Populous U.S. Cities
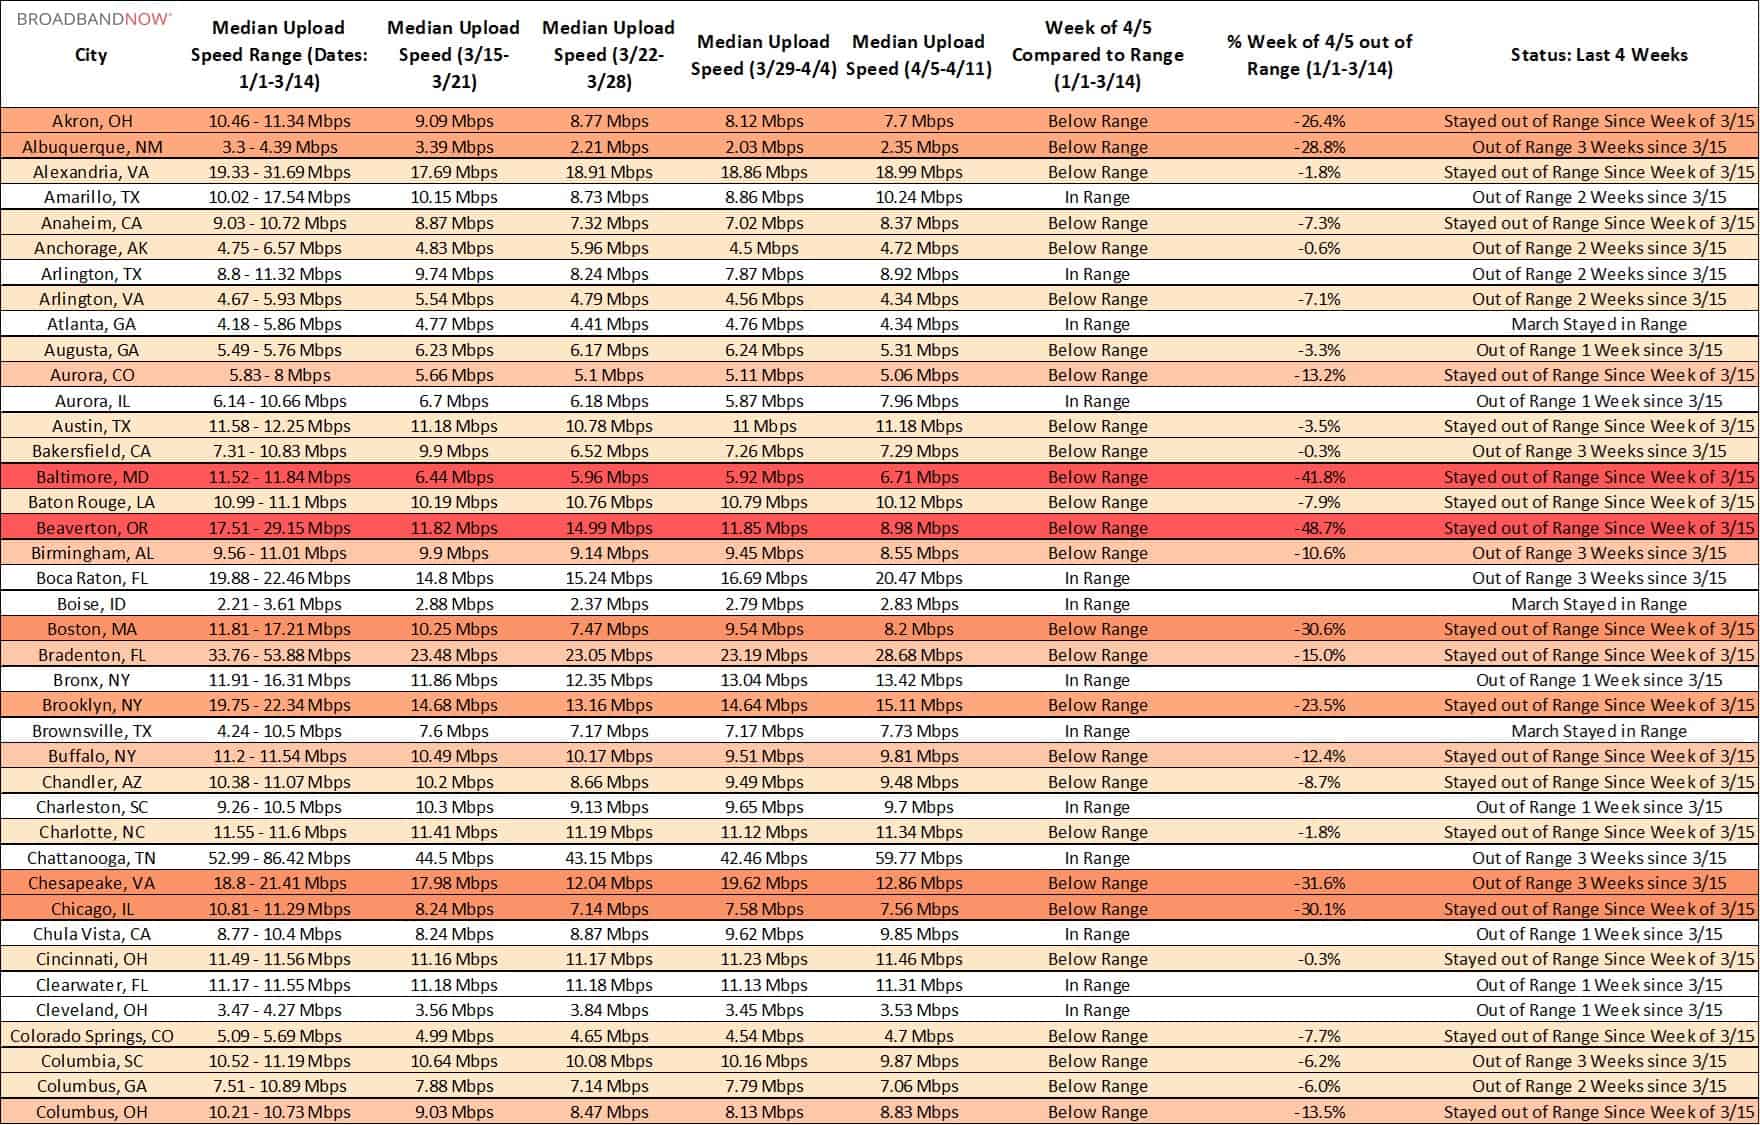
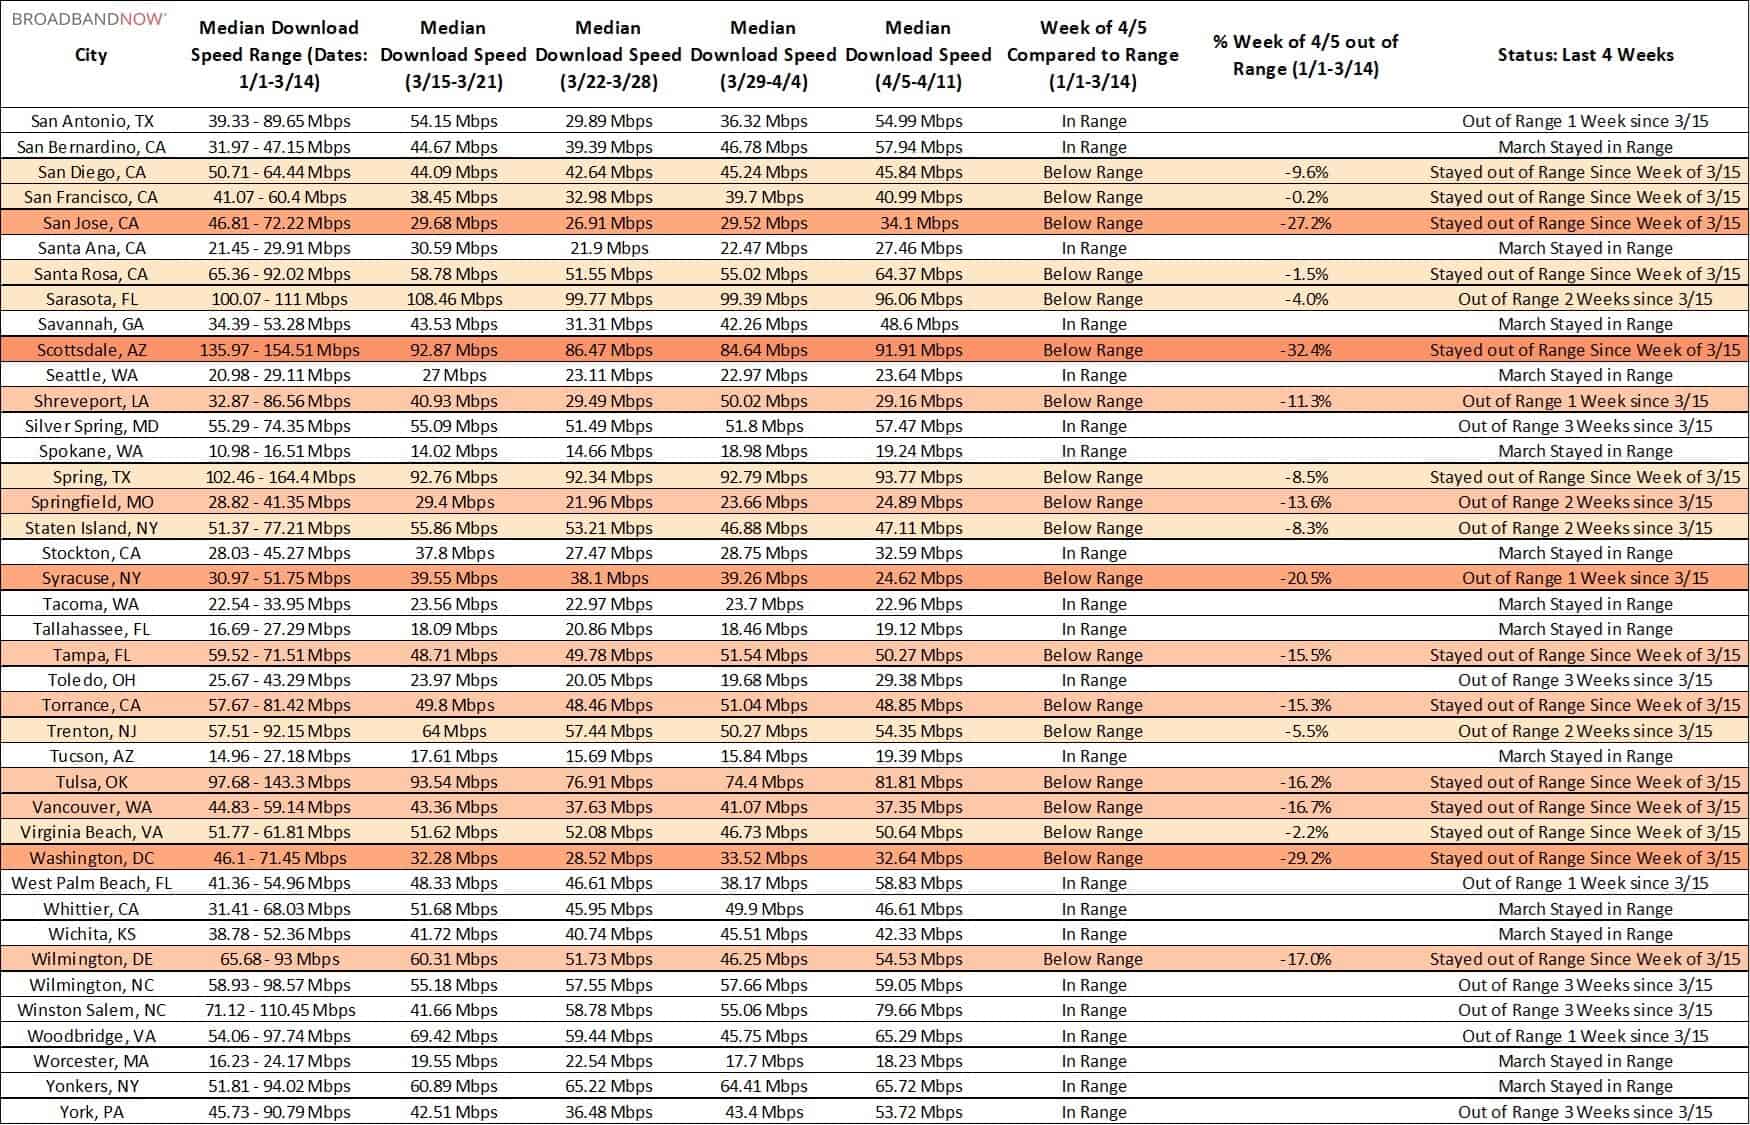
The tables below show both upload and download speed performance over the past four weeks in the 200 most populous cities in the U.S. If a city is “in range,” it means that its current median internet speeds are comparable to the range of speeds recorded over the first 11 weeks in 2020.
Networks have continued down a path of slow recovery, with improvements in dozens of cities for both upload and download speed performance. That said, compared to last week, two new cities are experiencing upload speed decreases of more than 40% out of range. In turn, two fewer cities are experiencing these significant dips on the download speed front.
Are you a journalist or researcher writing about this topic?
Contact us and we'll connect you with a broadband market expert on our team who can provide insights and data to support your work.
Upload Speeds Over Time
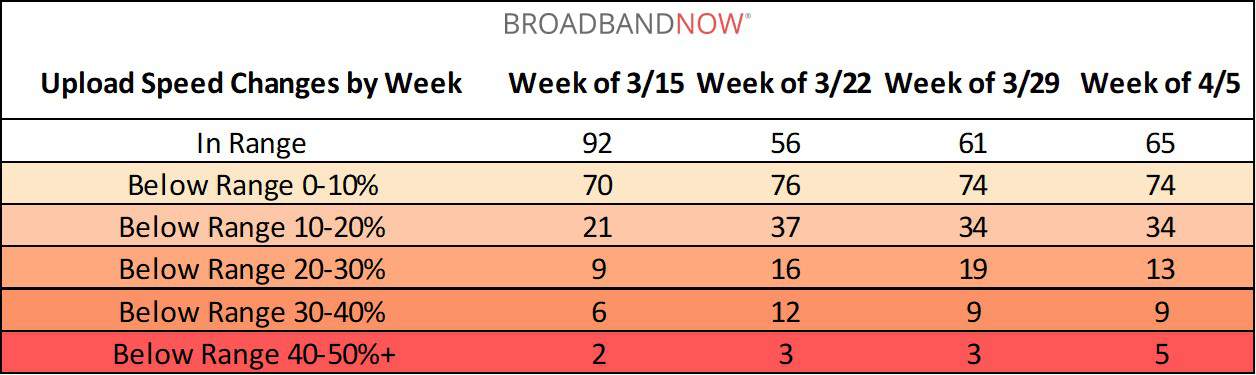
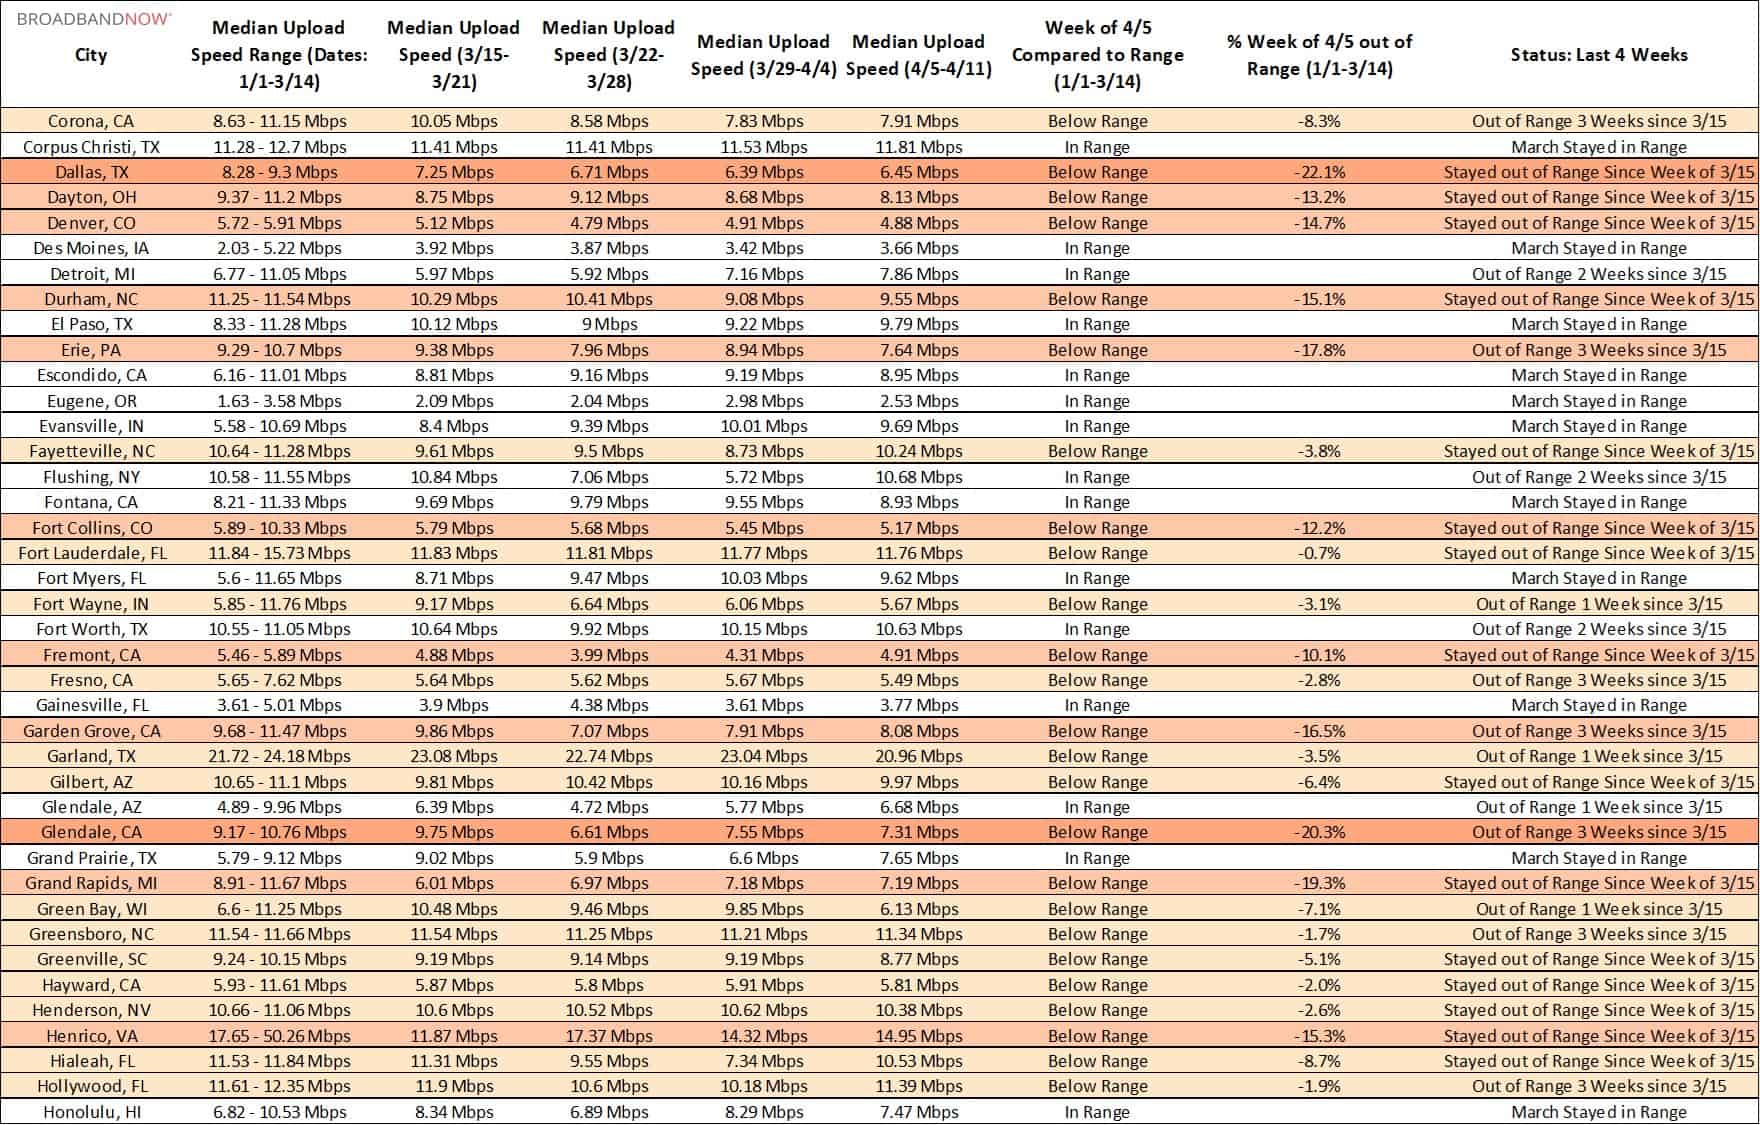
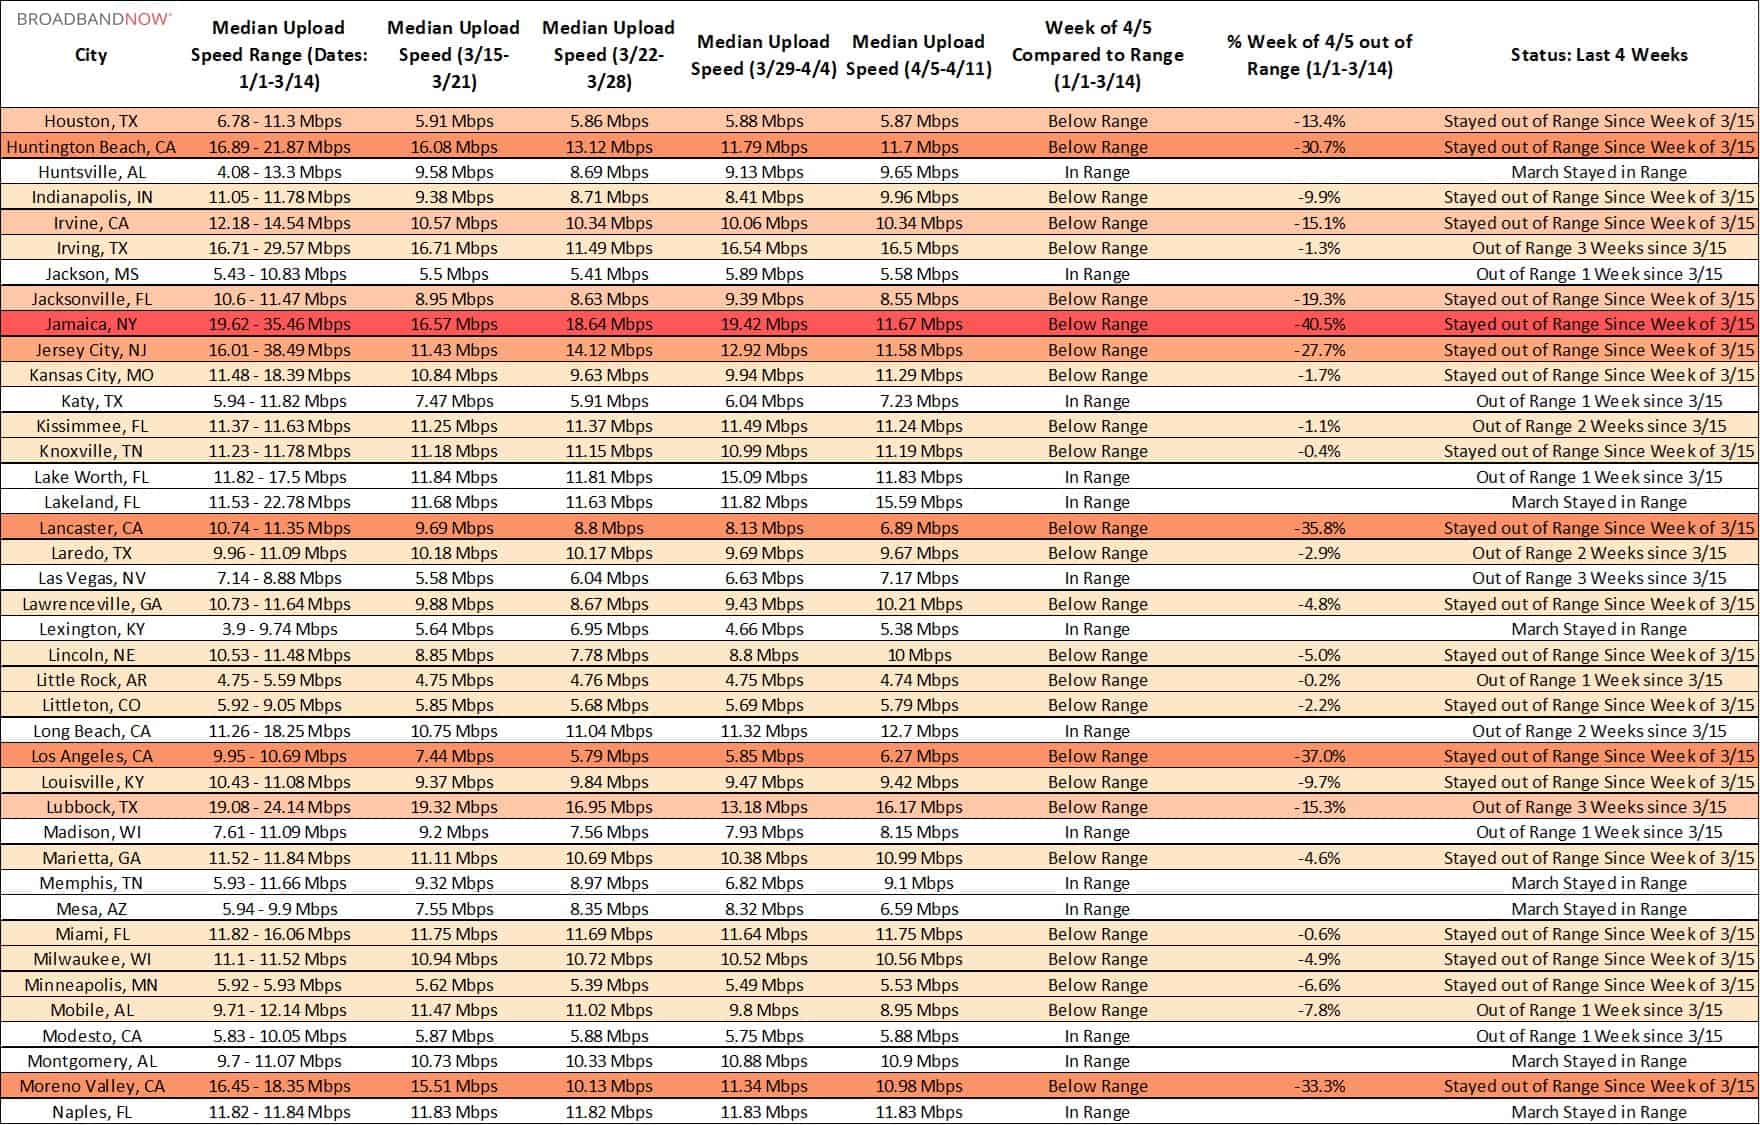
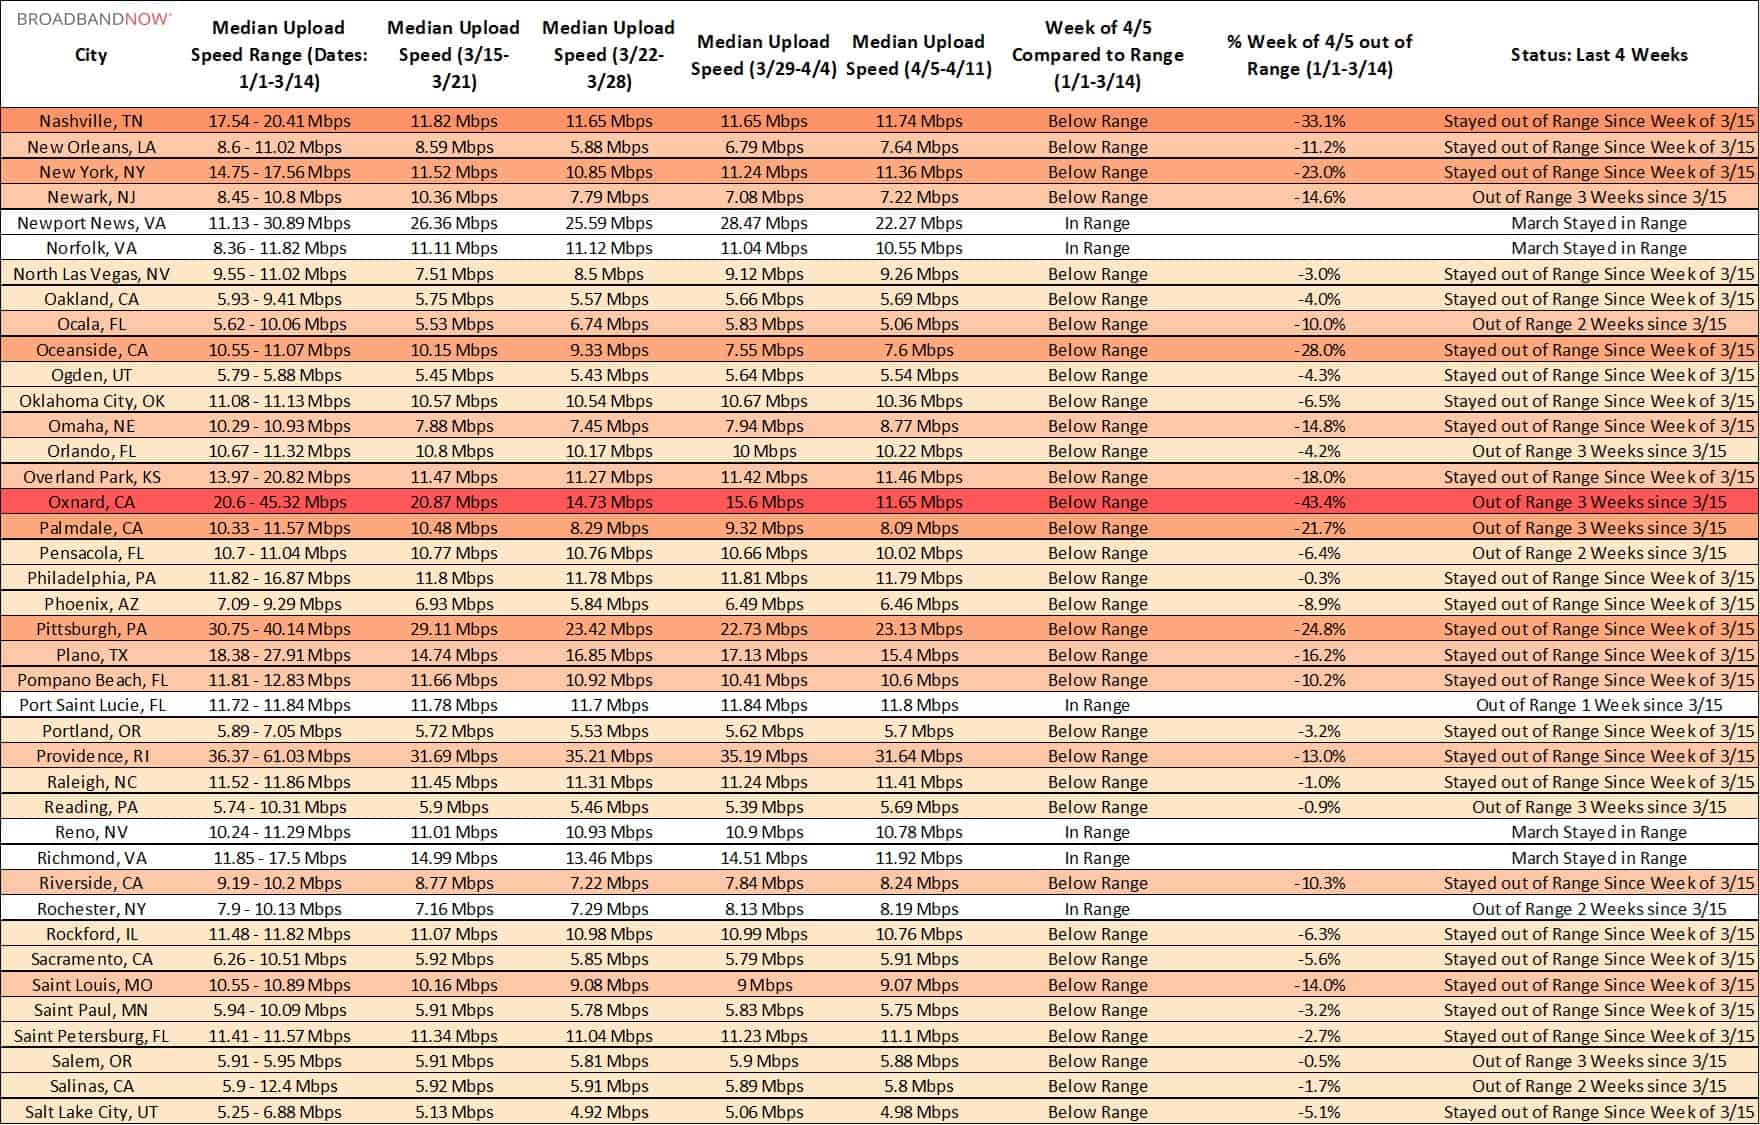
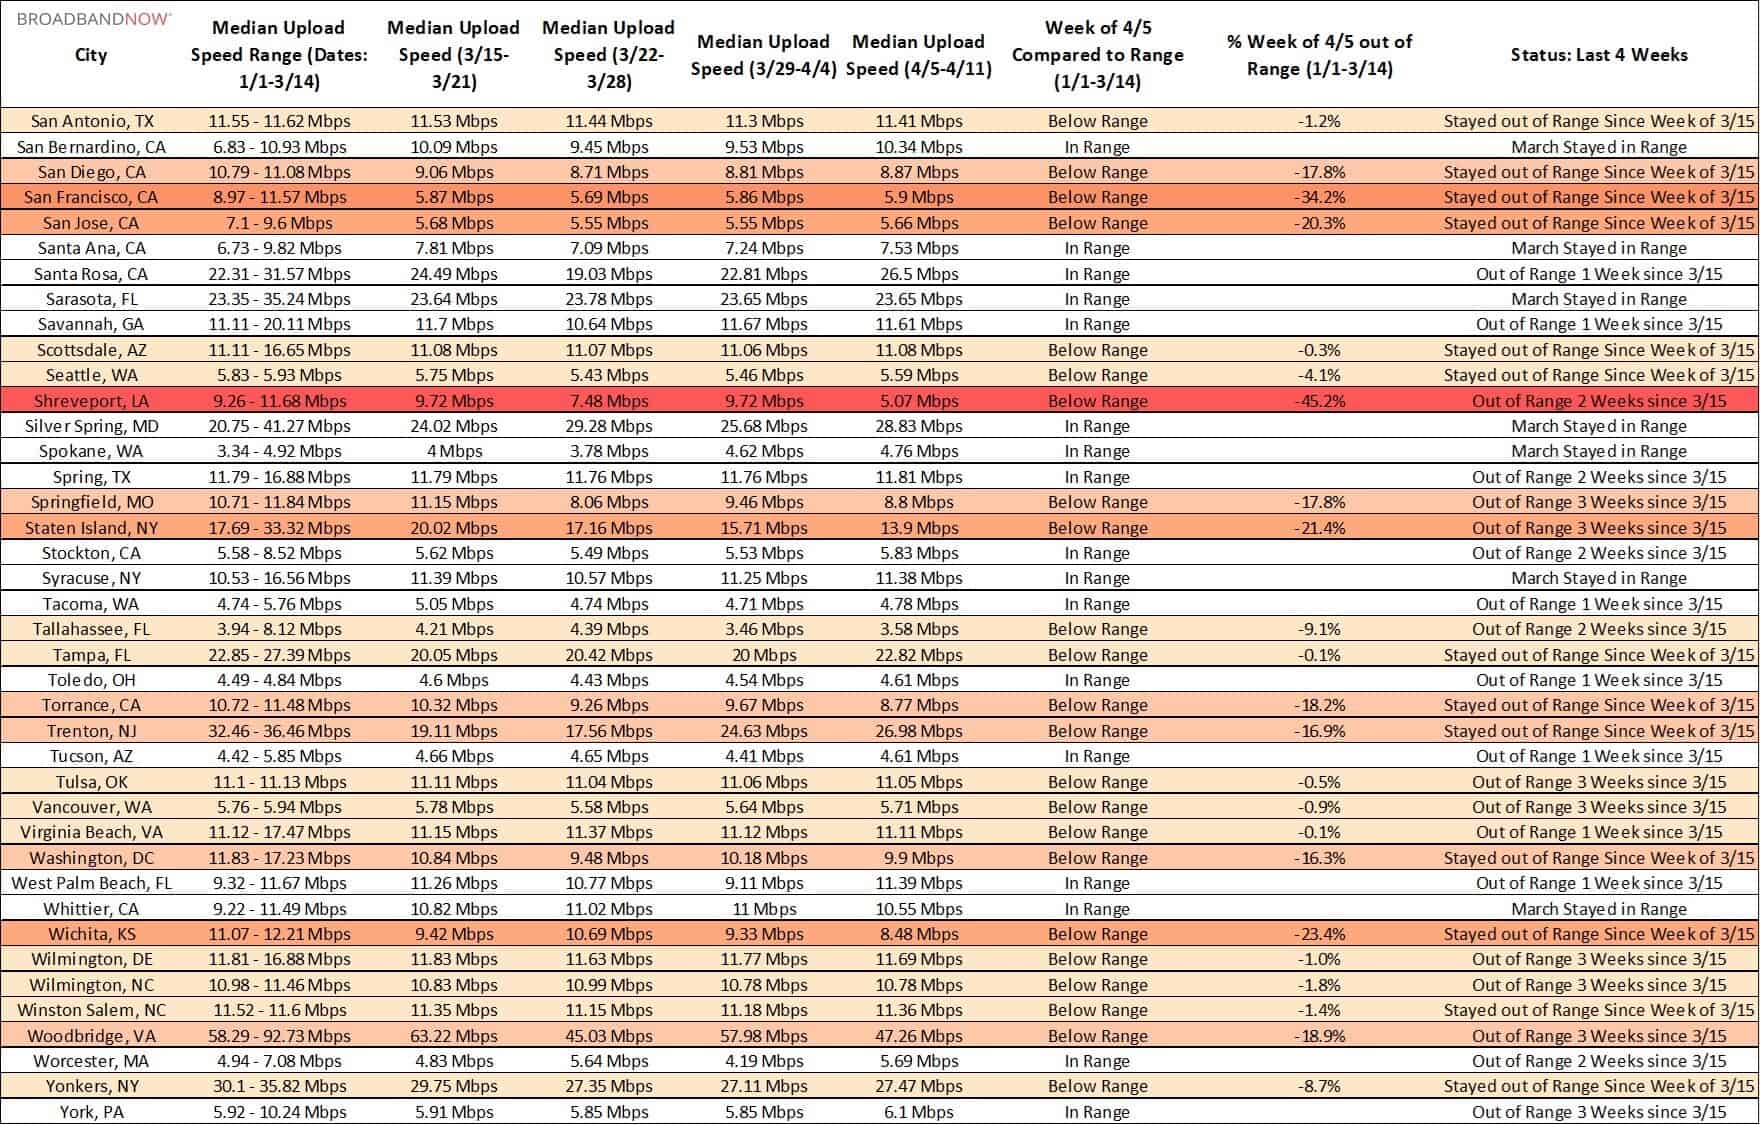
139 (69.5%) of the cities we are tracking have experienced little to no disruption (either in range or below by less than 10%) in upload speed performance over the past week. This is slightly up from last week, when the number was 135 cities, or 67.5% of the top 200.
Los Angeles, Baltimore, and Flushing, New York have all improved since last week’s report, though Baltimore remains 41.8% below its previous range. In addition, several new cities are seeing these more significant upload speed disruptions, including Beaverton, Oregon, Jamaica, New York, Oxnard, California, and Shreveport, Louisiana.
The tables below show upload speeds comparing the past four weeks to the weeks of 1/1 to 3/14 for the top 200 U.S. cities by population, in alphabetical order.
Download Speeds Over Time
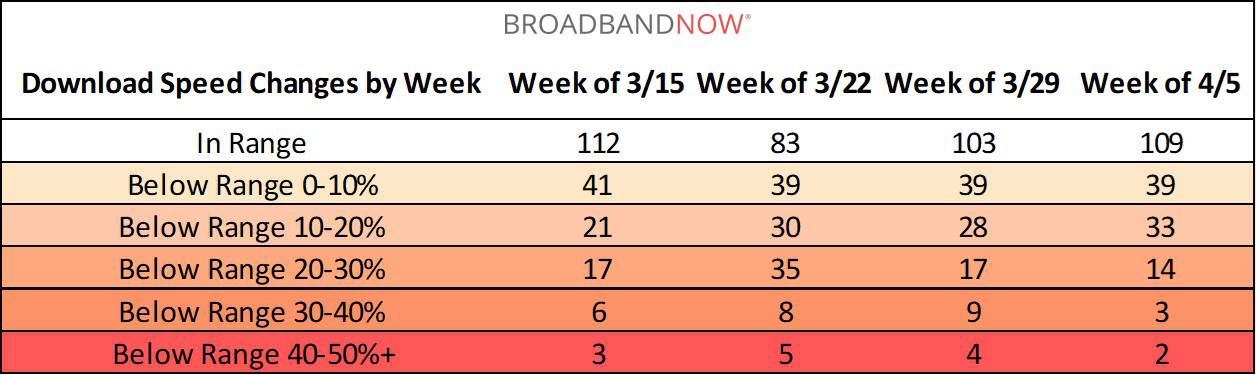
148 (74%) cities have recorded a less than 10% decrease in download speeds over the week of April 5th. This is a 3% increase from last week’s total of 142 cities.
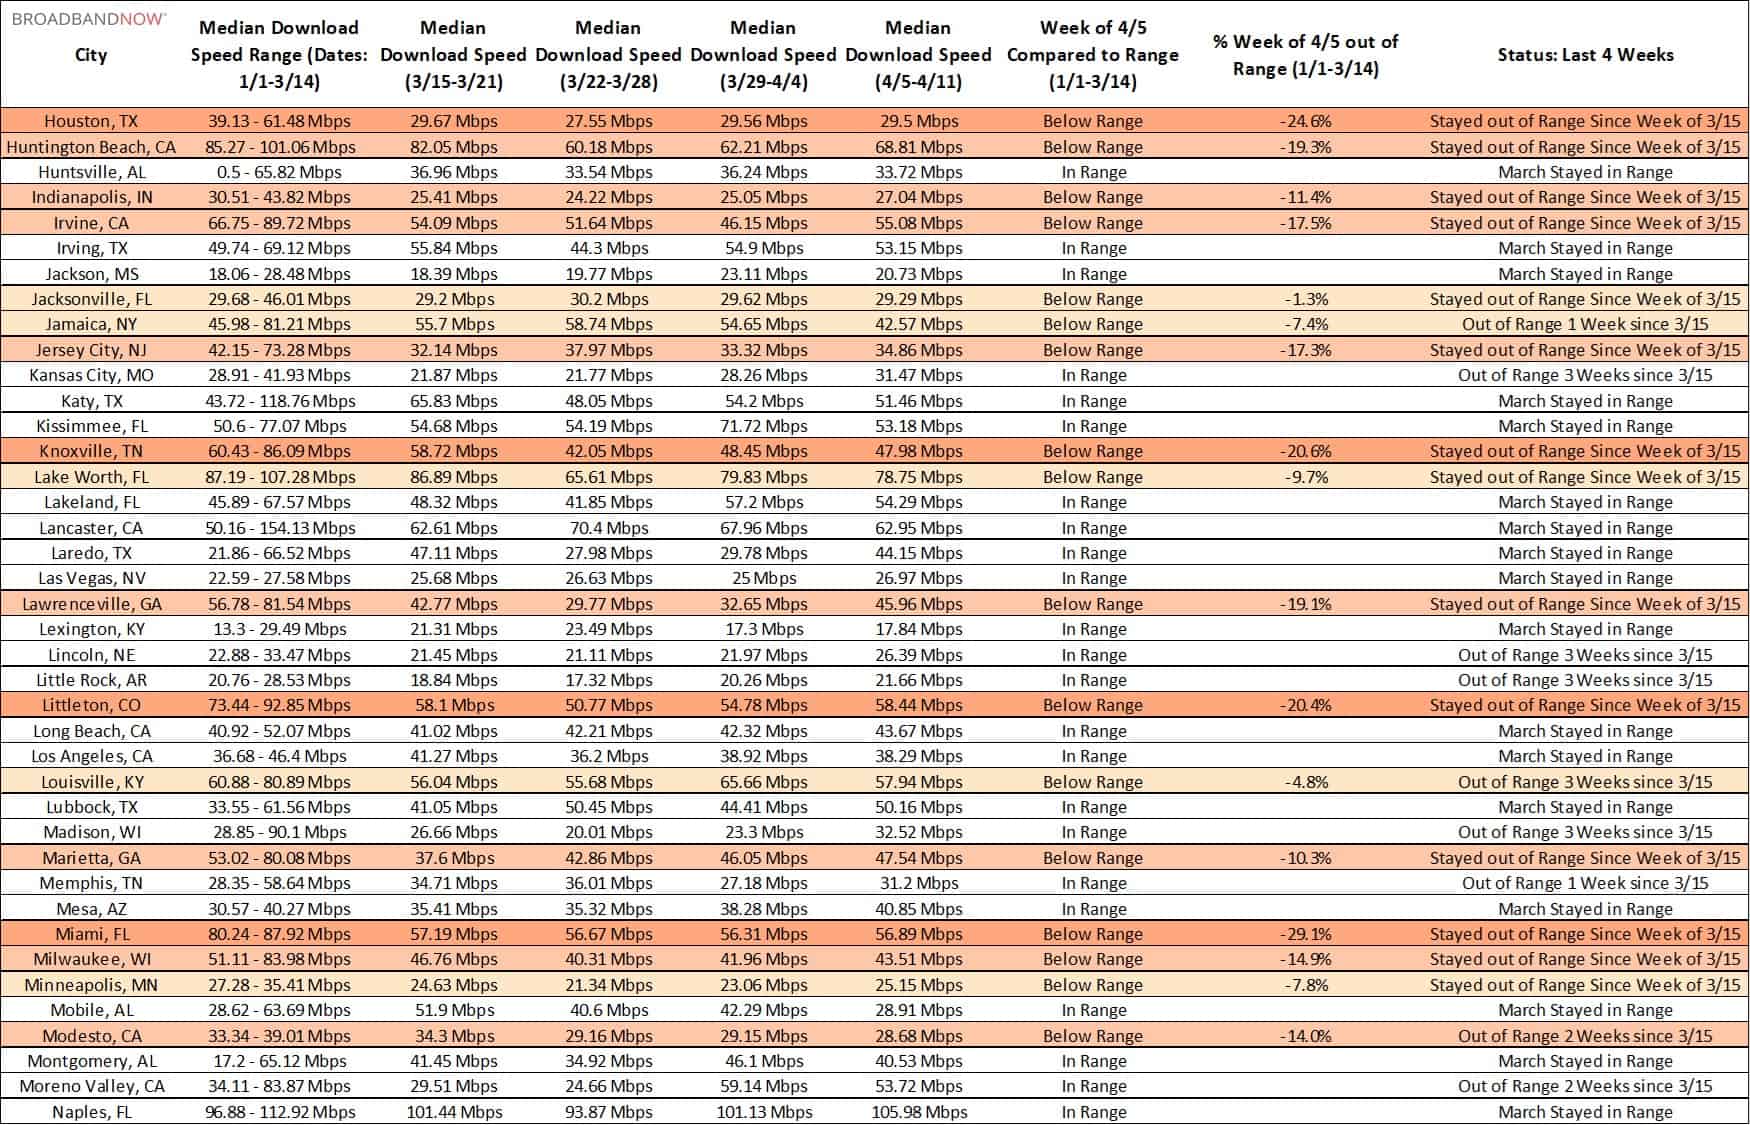
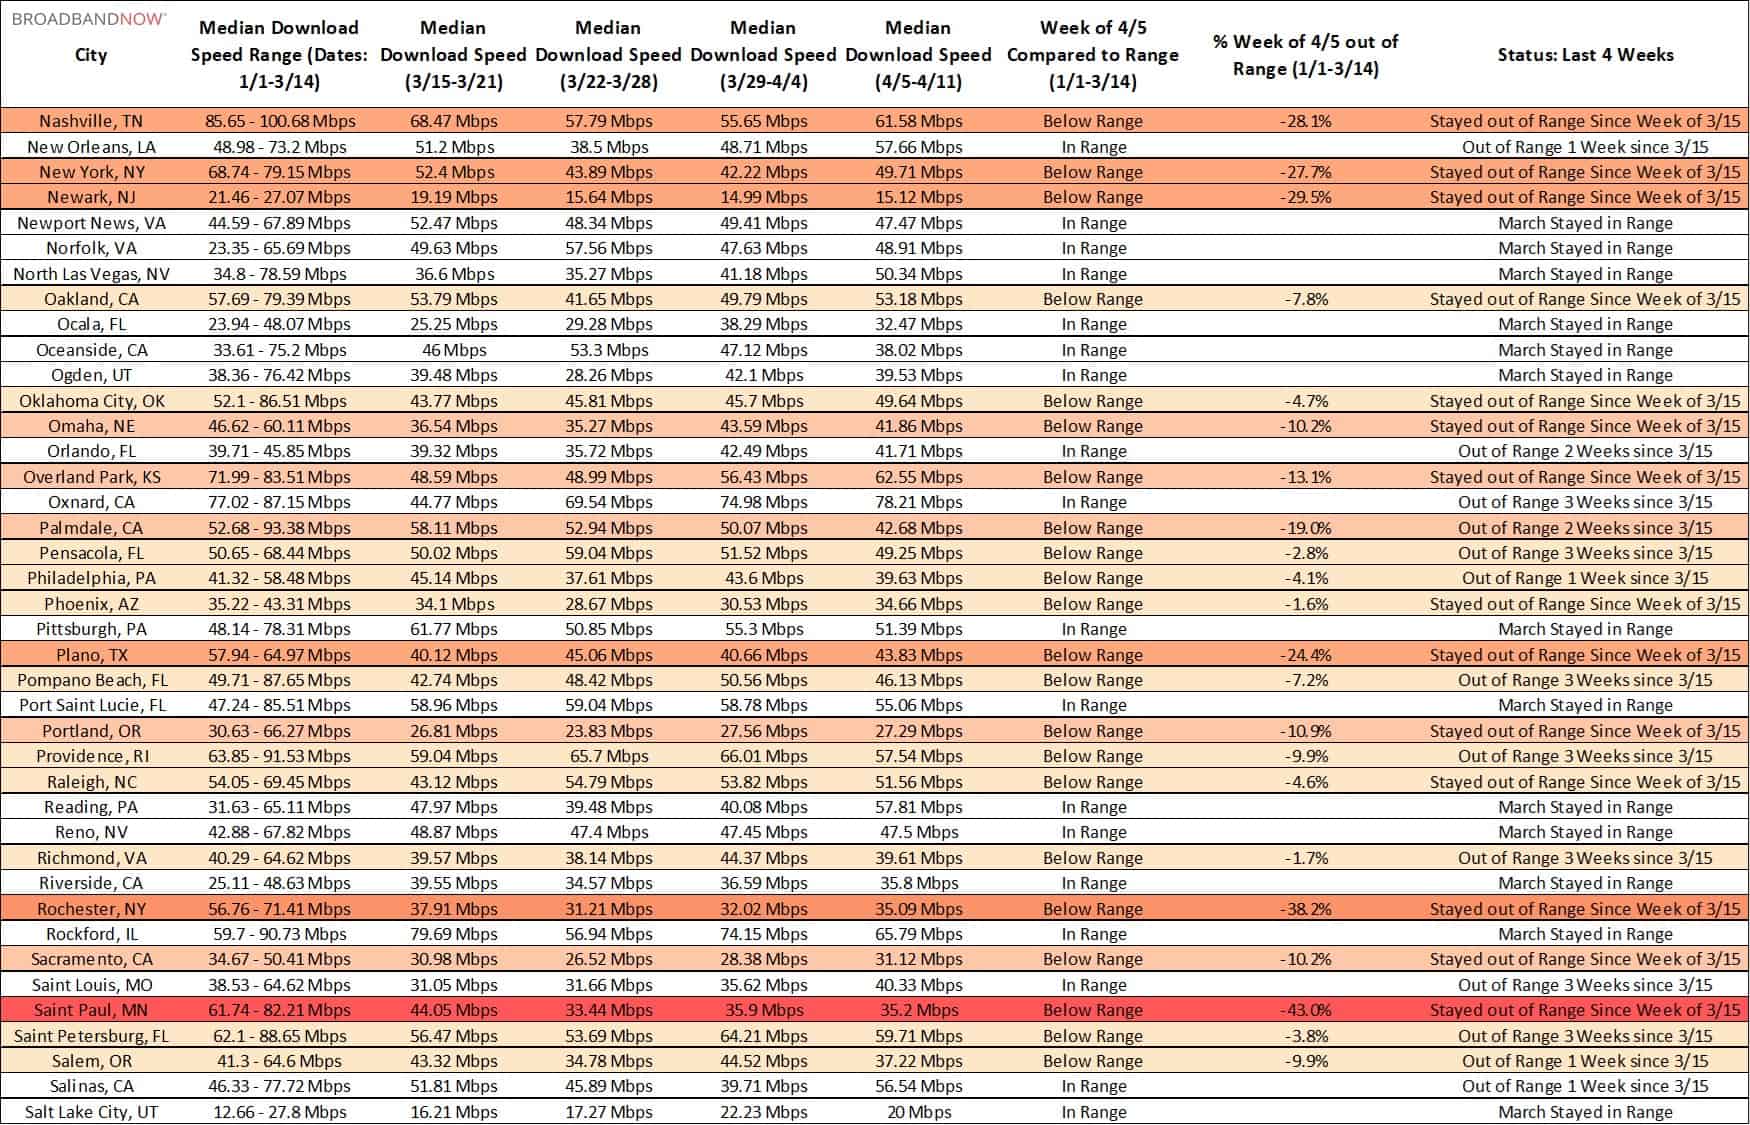
Several cities that fell more than 40% out of range last week have now begun to recover, including Lawrenceville, Georgia and Rochester, New York. However, Evansville, Indiana and Saint Paul, Minnesota have both remained down by a significant margin.
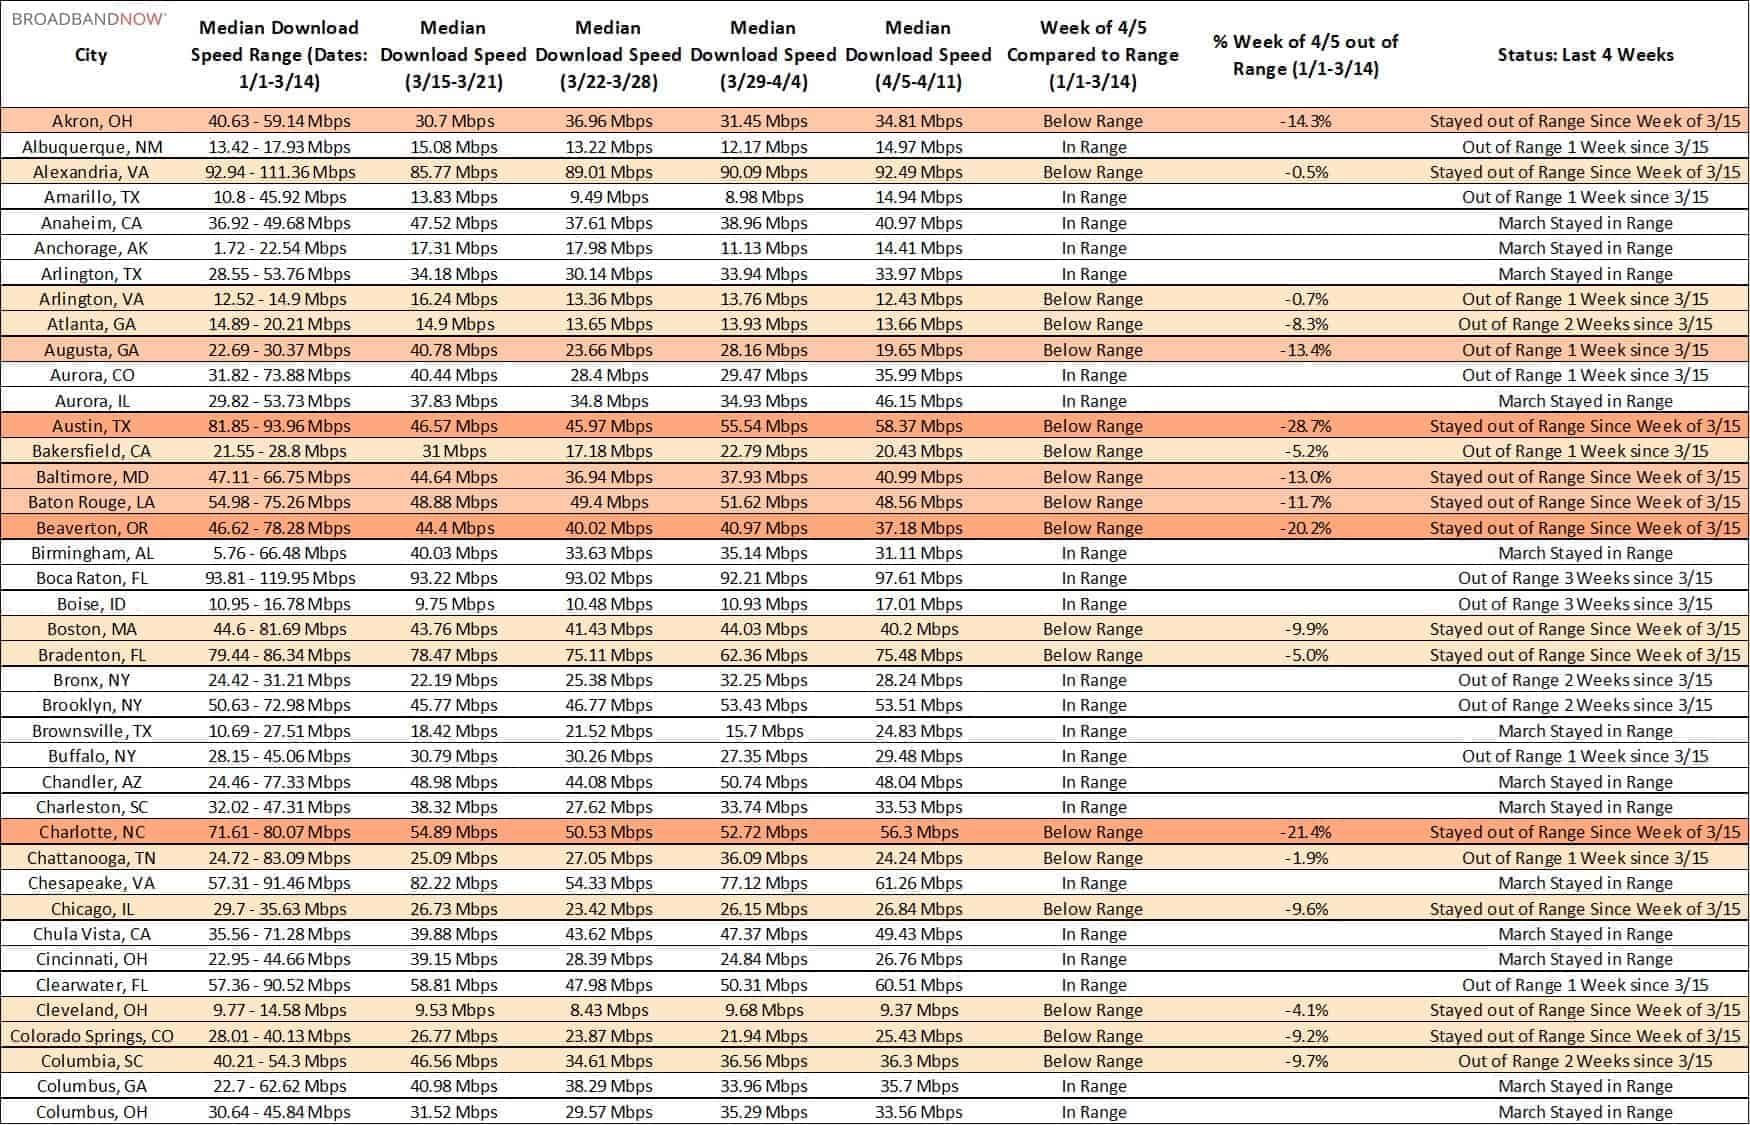
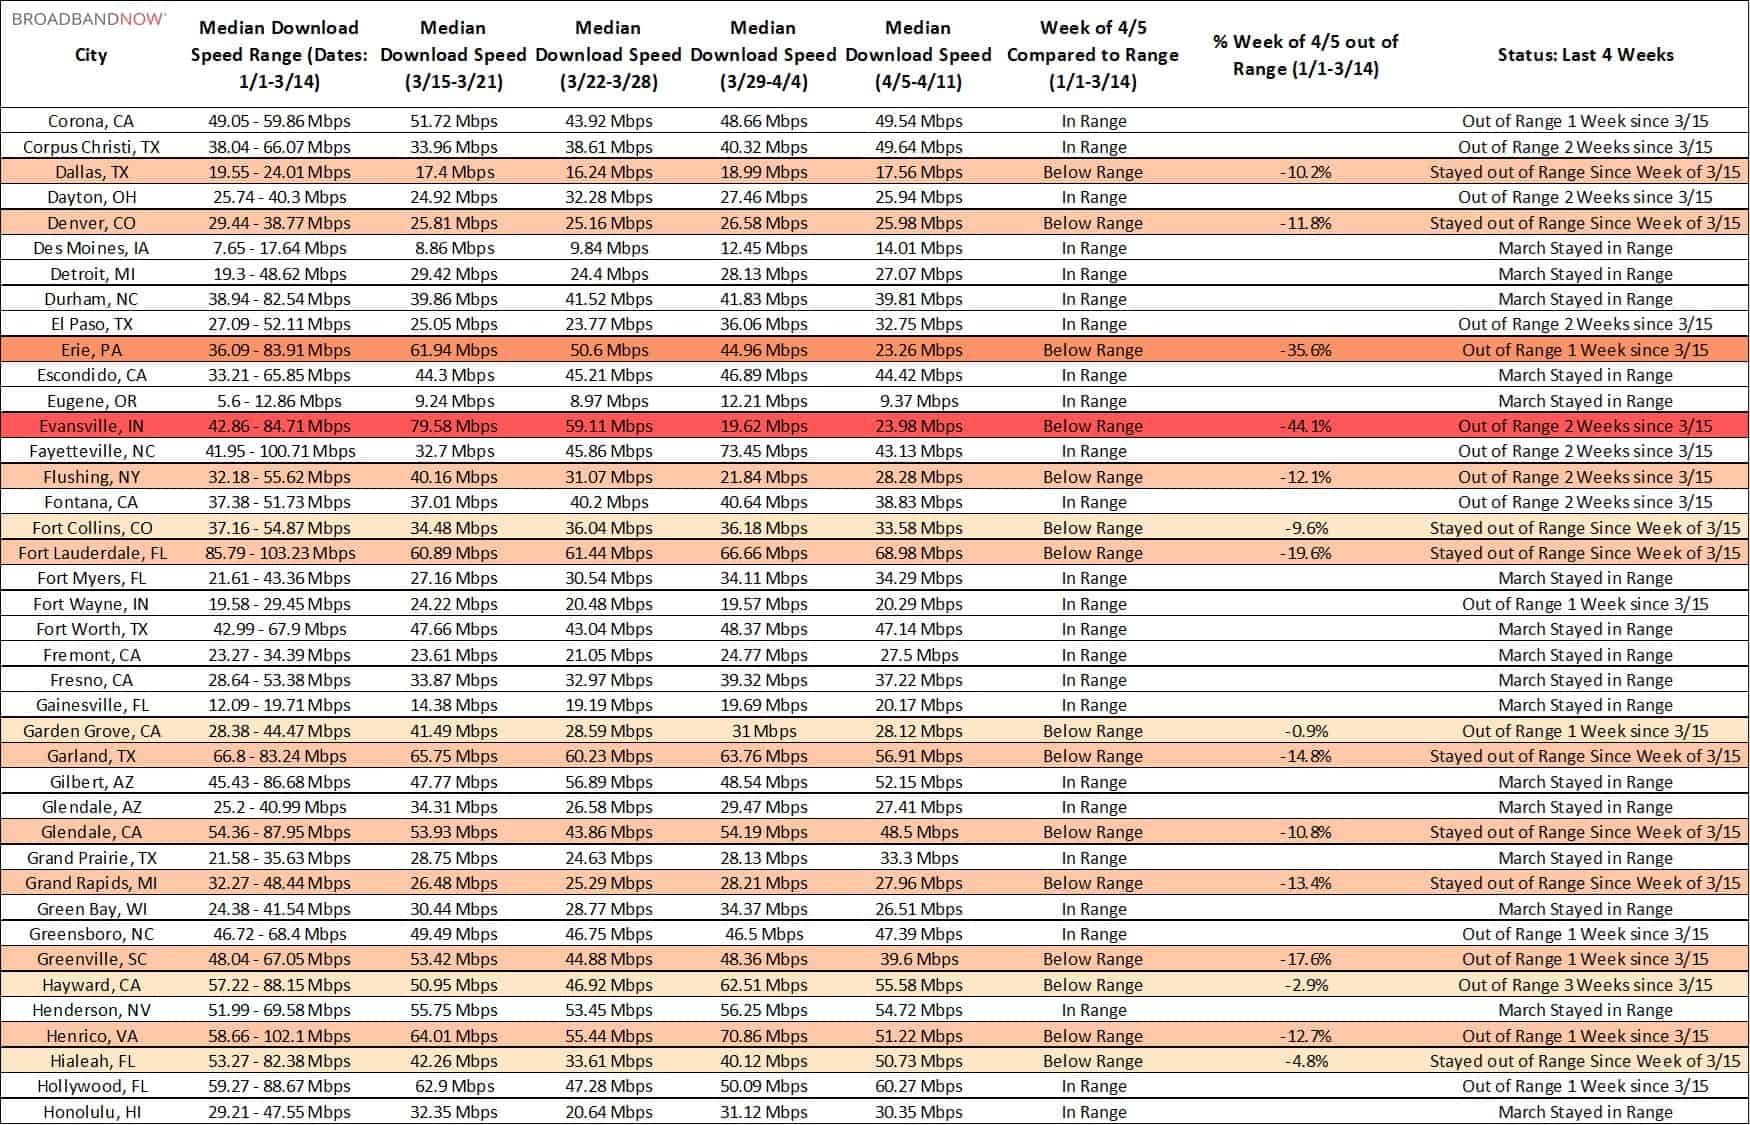
The tables below show download speeds comparing the past four weeks to the weeks of 1/1 to 3/14 for the top 200 U.S. cities by population, in alphabetical order.
Prior Reports
This report is the latest in a series of reports looking into the stability of American internet networks amid the coronavirus pandemic. You can read prior weeks’ reports below:
- Home Internet Connections Holding Steady In Most Major US Cities Amid Mass Shift To Remote Work
- Internet Speed Analysis: Top 200 Cities, March 15th – 21st
- Internet Speed Analysis: Rural, Top 200 Cities March 22nd – 28th
- Internet Speed Analysis: Rural, Top 200 Cities March 29th – April 4th
About The Data
We analyzed raw speed test data from M-Lab for the top 200 cities by population in the U.S. in order to determine how well ISP’s are coping with this unprecedented surge in demand. Data was taken from the past 15 calendar weeks, and we calculated median download speeds and ranges for every city listed based on this information.
We also looked at the rural areas as defined by the CDC’s Urban–Rural Classification Scheme as non-metropolitan areas and measured their speeds, in aggregate, by week. The M-Lab’s data we used includes all users running speed tests on various websites, and does not separate by device type or ISP.