The Affordable Connectivity Program (ACP) is an ongoing federal initiative designed to tackle the digital divide by providing low-income households a monthly discount on broadband services. It was created to replace the Emergency Broadband Benefit (EBB), which started during the Covid-19 pandemic, reshaping it by easing the eligibility requirements and reducing the size of the benefit.
By expanding eligibility to any household making less than 200% of the federal poverty guidelines, the program promised to bring affordable broadband internet to more people than ever. It also has enhanced benefits for those on qualifying tribal lands and those in unserved areas.
Despite this, our analysis suggests that only 29% of qualifying households currently take advantage of the program. As many as 48 million households could be missing out on a $30 monthly broadband discount.
Key Findings:
- Total enrollment in the ACP has more than doubled since December 2021, expanding from 9.2 million households to 19.5 million in July 2023.
- Despite the growth, enrollment remains very low overall. According to our estimates, only 29% of qualifying households have taken advantage of the program. Another 48 million qualified households are not benefitting from the ACP.
- The three states with the highest adoption rate are Washington D.C., Louisiana, and Kentucky, while the three states with the lowest rate of adoption are Utah, South Dakota, and North Dakota.
- The typical state has almost 600,000 eligible households that still need to be enrolled. This means states are missing out on up to nearly $18 million in monthly broadband discounts for low-income households.
- Half of the ACP’s total funding has been used so far. Given the rising enrollment rate, we predict that, without additional funding, the program will run out around March 2024
Current ACP Enrollment Levels
The FCC recently announced that as of August 2023, enrollment in the ACP has crossed 20 million households, which is in line with our projections. Now that the program is well underway, we wanted to understand how successful it has been over the past year and a half and determine a rough timeline for when funding may expire.
To do this, we cross-referenced data from the U.S. Census Bureau’s American Community Survey with the IRS Individual Income Tax statistics and compared that to the HHS poverty guidelines.
10 Best and Worst States for ACP Enrollment – May 2023
| Top 10 States | Bottom 10 States | ||
|---|---|---|---|
| State | Enrollment Rate | State | Enrollment Rate |
| Washington, D.C. | 50% | Utah | 8% |
| Louisiana | 46% | North Dakota | 10% |
| Kentucky | 41% | South Dakota | 11% |
| Ohio | 38% | Idaho | 11% |
| New Mexico | 36% | Alaska | 11% |
| Oklahoma | 35% | New Hampshire | 13% |
| North Carolina | 35% | Hawaii | 14% |
| Alabama | 35% | New Jersey | 14% |
| Mississippi | 32% | Vermont | 16% |
| South Carolina | 32% | Iowa | 17% |
The Top 5 Most Improved States, January-May 2023
| States | January 2022 Enrollment Rate | May 2023 Enrollment Rate | Percentage Point Difference in Enrollment |
|---|---|---|---|
| Louisiana | 24% | 46% | 22% |
| Maine | 11% | 31% | 20% |
| Washington, D.C. | 31% | 50% | 19% |
| North Carolina | 17% | 35% | 18% |
| Kentucky | 24% | 41% | 18% |
With enrollment in the ACP more than doubling since the transition from the EBB, and the growth rate in that enrollment accelerating in recent months, more people than ever are getting help with their broadband bills as the program has hit its stride.
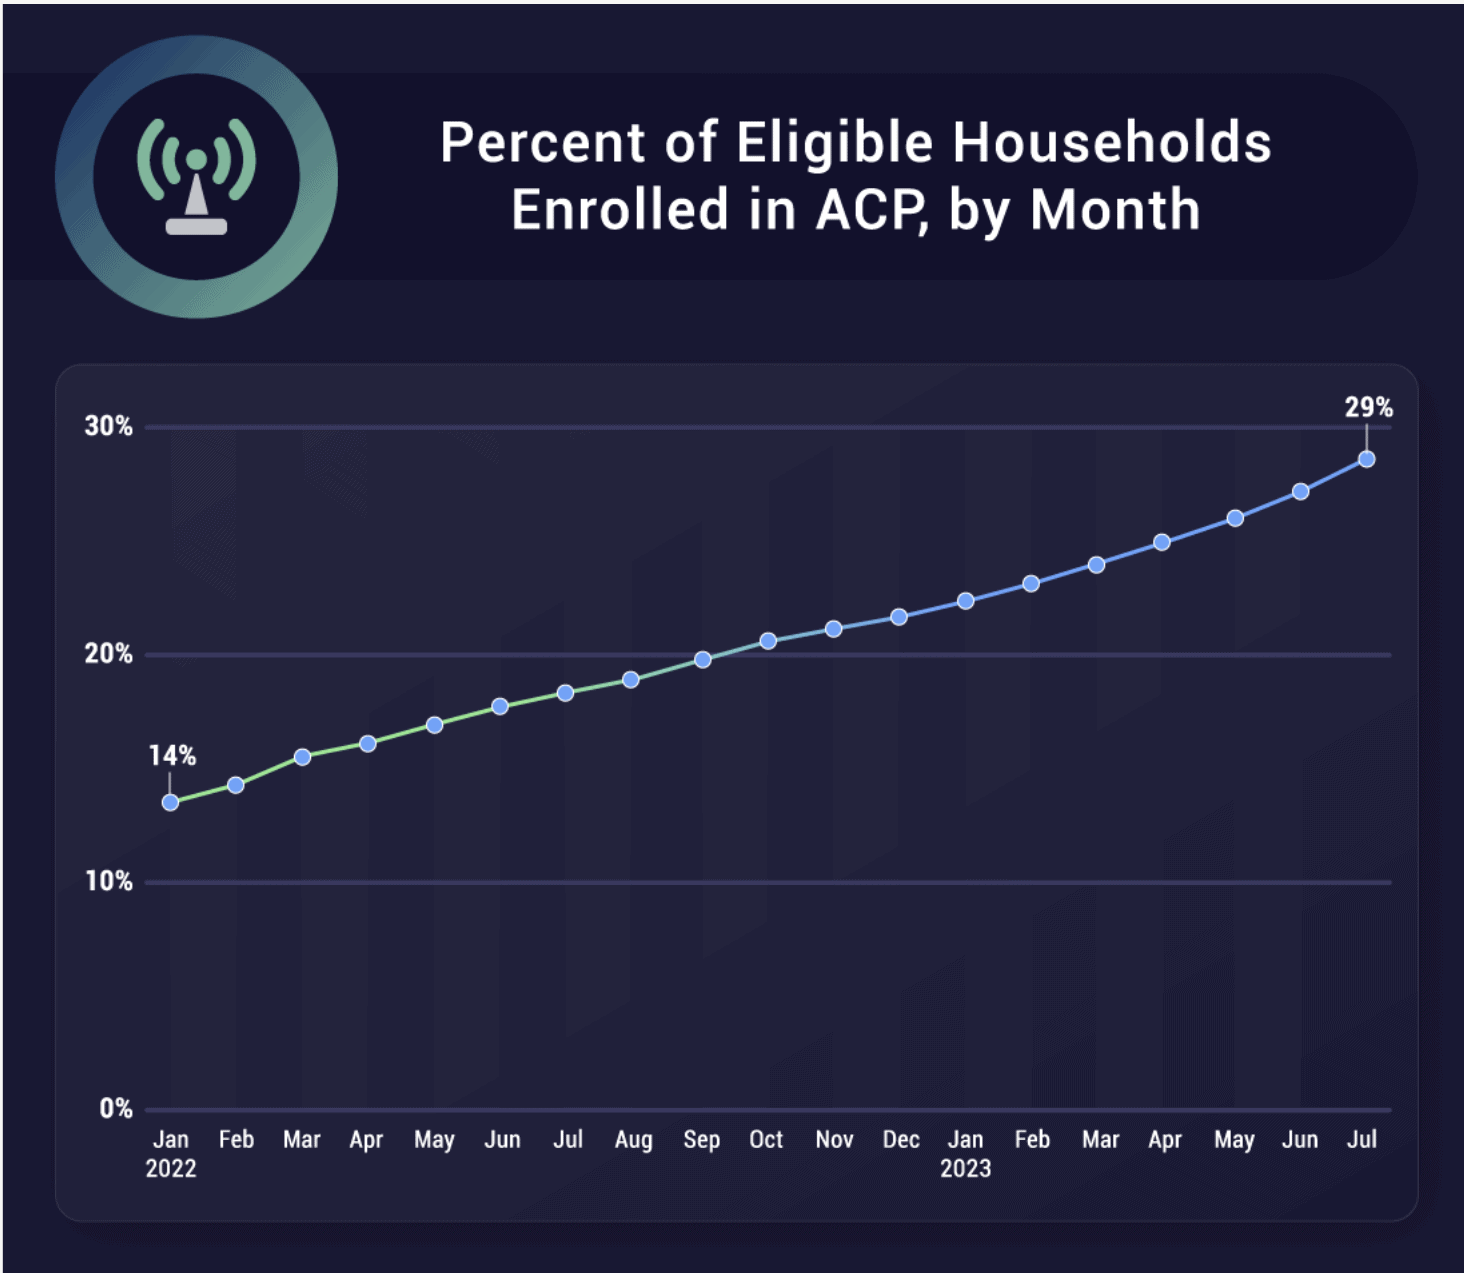
However, enrollment still has ample room to improve, with less than 30% of the 68 million estimated eligible households enrolled as of July 2023. That figure is especially noteworthy when considering that our methodology is intended to provide a floor for the actual number of eligible households. There are likely to be millions more eligible households not included in our estimate, making the actual enrollment rate considerably lower.
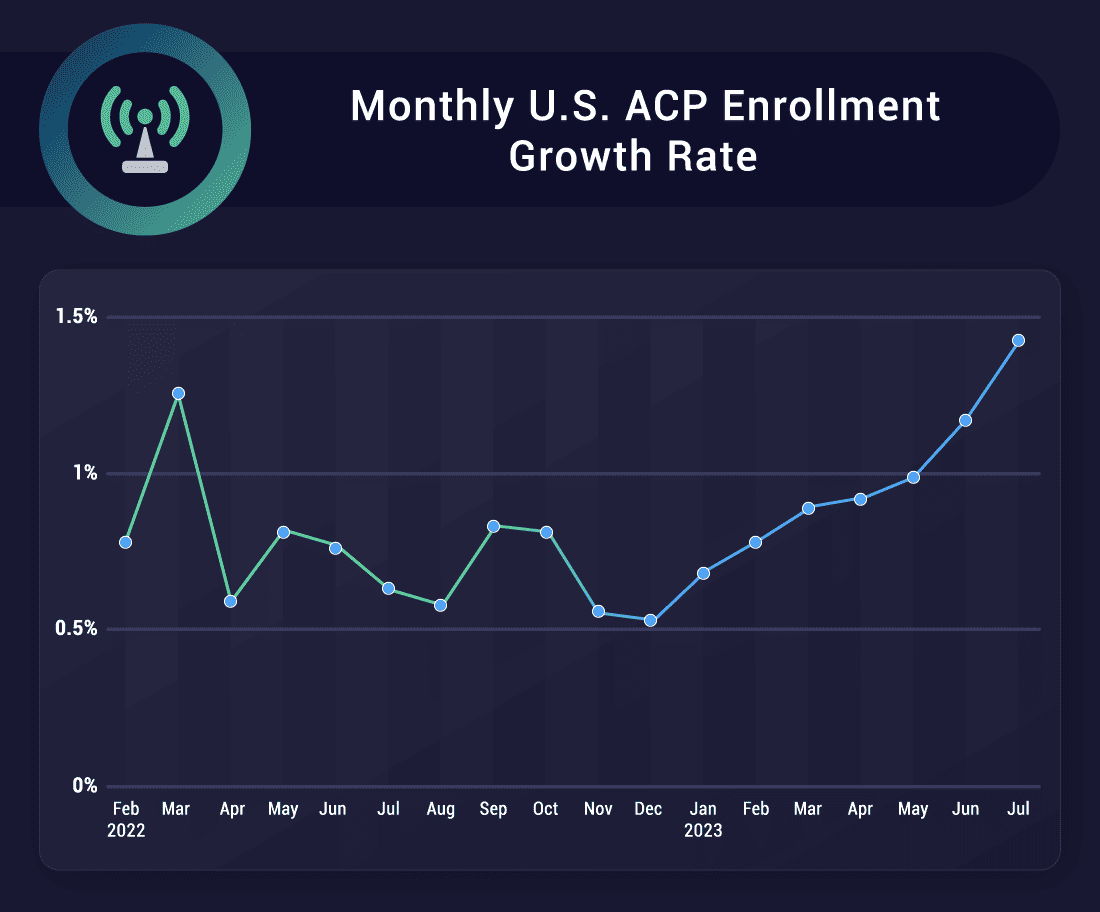
Based on our estimate for the number of EBB-eligible households in our EBB Report, the enrollment rate at the end of that program was approximately 30%. Currently, the ACP still lags just behind that with 29%, but with a current growth rate of 1.5%, the ACP is all but guaranteed to overtake that very soon.
Although there’s plenty of good news surrounding ACP enrollment, it’s not equally spread across the U.S. Some areas like D.C. and Louisiana have very high adoption rates — 50% and 46%, respectively — while others like Utah and North Dakota have meager adoption rates—8% and 10% respectively. There’s also a significant overlap in the most improved states and those with the highest adoption rate.
To understand why some states have seen higher enrollment than others, we looked at data from the ACP Outreach Grant Program, where the FCC awards grants to programs that help promote enrollment in the ACP. The FCC has already announced $66 million in outreach grants, with California receiving the most of any state ($6 million). Other states like West Virginia, New Hampshire, and Delaware, didn’t receive any funding.

Analyzing these numbers reveals that, while not perfect, there is a statistically significant correlation between the total outreach funds granted and the nationwide rank for enrollment. While this does not show causation, it is a possible explanation for why some states see better enrollment than others.
The FCC released its notice for the Outreach Grant program in November 2022, and since then, enrollment growth has gone from a pretty steady 0.7% to increasing every single month until July, when it had doubled to over 1.4%.
ACP Enrollment Rankings
| State | ACP Award Amount | Outreach Grant Amount Rank | Enrollment Rank |
|---|---|---|---|
| ALASKA | $1,811,635 | 10 | 47 |
| ALABAMA | $500,000 | 36 | 8 |
| ARKANSAS | $1,670,000 | 13 | 18 |
| ARIZONA | $1,881,140 | 8 | 19 |
| CALIFORNIA | $6,151,659 | 1 | 22 |
| COLORADO | $935,000 | 31 | 37 |
| CONNECTICUT | $500,000 | 37 | 29 |
| WASHINGTON, D.C. | $5,700,000 | 2 | 1 |
| DELAWARE | $0 | 51 | 36 |
| FLORIDA | $864,355 | 32 | 21 |
| GEORGIA | $1,000,000 | 29 | 20 |
| HAWAII | $1,090,000 | 25 | 45 |
| IOWA | $83,234 | 48 | 42 |
| IDAHO | $280,641 | 45 | 48 |
| ILLINOIS | $1,863,719 | 9 | 33 |
| INDIANA | $1,275,000 | 18 | 25 |
| KANSAS | $500,000 | 38 | 40 |
| KENTUCKY | $500,000 | 39 | 3 |
| LOUISIANA | $940,950 | 30 | 2 |
| MASSACHUSETTS | $550,000 | 35 | 27 |
| MARYLAND | $2,730,000 | 5 | 39 |
| MAINE | $1,229,198 | 20 | 12 |
| MICHIGAN | $1,264,125 | 19 | 13 |
| MINNESOTA | $1,043,411 | 26 | 38 |
| MISSOURI | $1,675,000 | 12 | 24 |
| MISSISSIPPI | $1,800,000 | 11 | 9 |
| MONTANA | $500,000 | 40 | 34 |
| NORTH CAROLINA | $1,200,000 | 21 | 7 |
| NORTH DAKOTA | $800,000 | 33 | 50 |
| NEBRASKA | $500,000 | 41 | 35 |
| NEW HAMPSHIRE | $0 | 50 | 46 |
| NEW JERSEY | $1,426,920 | 15 | 44 |
| NEW MEXICO | $1,504,234 | 14 | 5 |
| NEVADA | $1,200,000 | 22 | 15 |
| NEW YORK | $3,075,000 | 4 | 11 |
| OHIO | $1,900,000 | 7 | 4 |
| OKLAHOMA | $2,188,901 | 6 | 6 |
| OREGON | $1,024,780 | 28 | 30 |
| PENNSYLVANIA | $1,150,000 | 24 | 26 |
| RHODE ISLAND | $450,000 | 44 | 17 |
| SOUTH CAROLINA | $225,750 | 46 | 10 |
| SOUTH DAKOTA | $200,000 | 47 | 49 |
| TENNESSEE | $1,200,000 | 23 | 23 |
| TEXAS | $3,285,200 | 3 | 28 |
| UTAH | $1,028,589 | 27 | 51 |
| VIRGINIA | $688,990 | 34 | 31 |
| VERMONT | $500,000 | 42 | 43 |
| WASHINGTON | $1,280,235 | 17 | 32 |
| WISCONSIN | $1,389,800 | 16 | 14 |
| WEST VIRGINIA | $0 | 49 | 16 |
| WYOMING | $474,777 | 43 | 41 |
And while states paint a better picture of the enrollment situation locally than the U.S. in the aggregate, there is a vast disparity between different zip codes, even when they are near each other or within the same state.
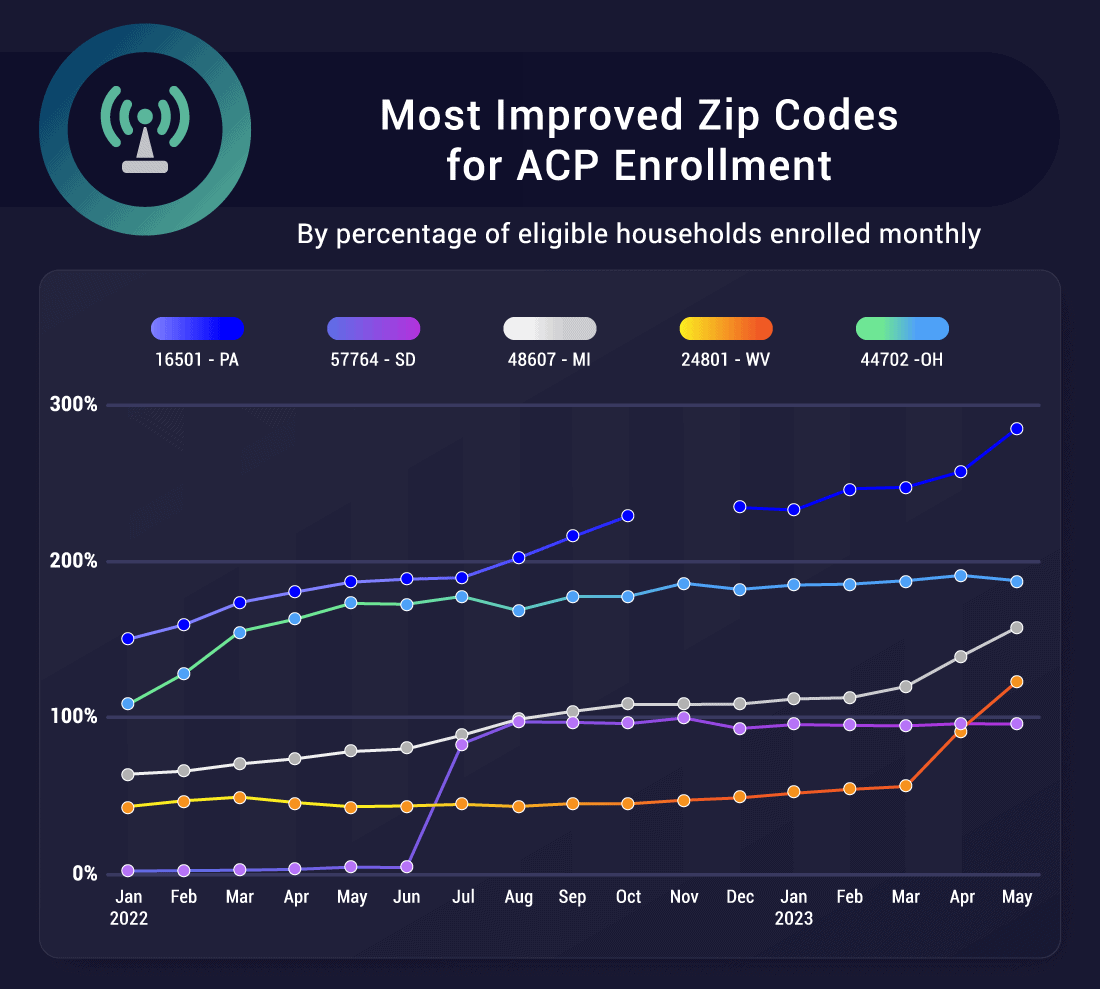
Note: The gap in the line for zip code 16501 is due to a missing value in the official Universal Service Administrative Co. (USAC) data.While the lines in the Most Improved and Highest Adoption graphs for states were more narrowly concentrated and better resembled each other, these lines are much more diverse and spread out. Interestingly, zip code 57764 in South Dakota went from a nearly 0% adoption rate to nearly 100% in a sudden jump around July 2022.
Here, many residents are members of the Oglala Lakota Nation. There are 83 different zip codes that have the best enrollment, all achieving full enrollment of their estimated number of eligible households. There is a tie for last place with 200 different zip codes having only one enrolled household as of May 2023, when between 30 and 330 households were eligible in each. There are also many more zip codes with eligible households with zero enrollment.
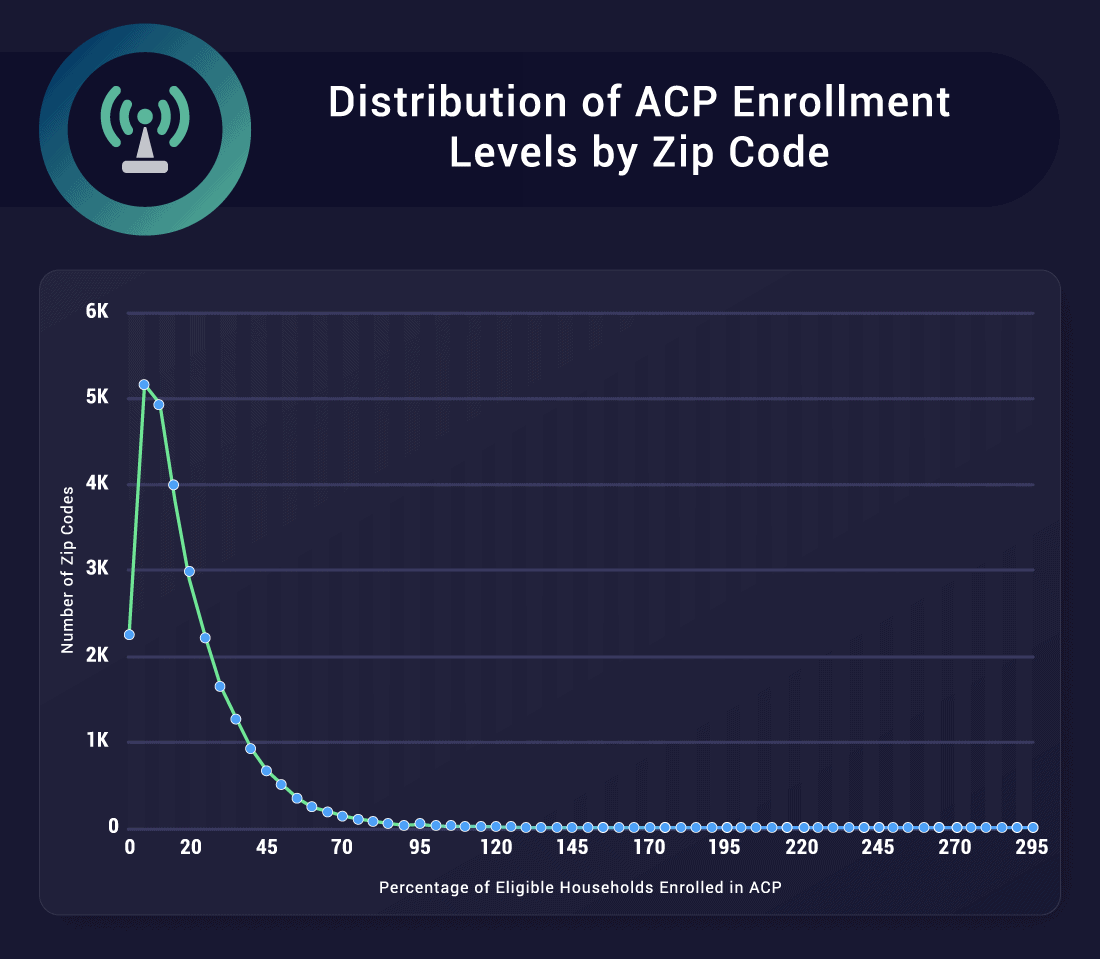
The distribution of enrollment rates for different zip codes resembles a bell curve. Most zip codes are concentrated around a median enrollment rate of 17 percent, with some outliers stretching far to the right side of the graph.
How Much ACP Funding Has Been Used?
The government established the ACP with over $17 billion in funding, with $100 million going to outreach, $66 million of which has been announced, and another $10 million to government broadband mapping efforts. After a year and a half, only $8 billion in funding remains.
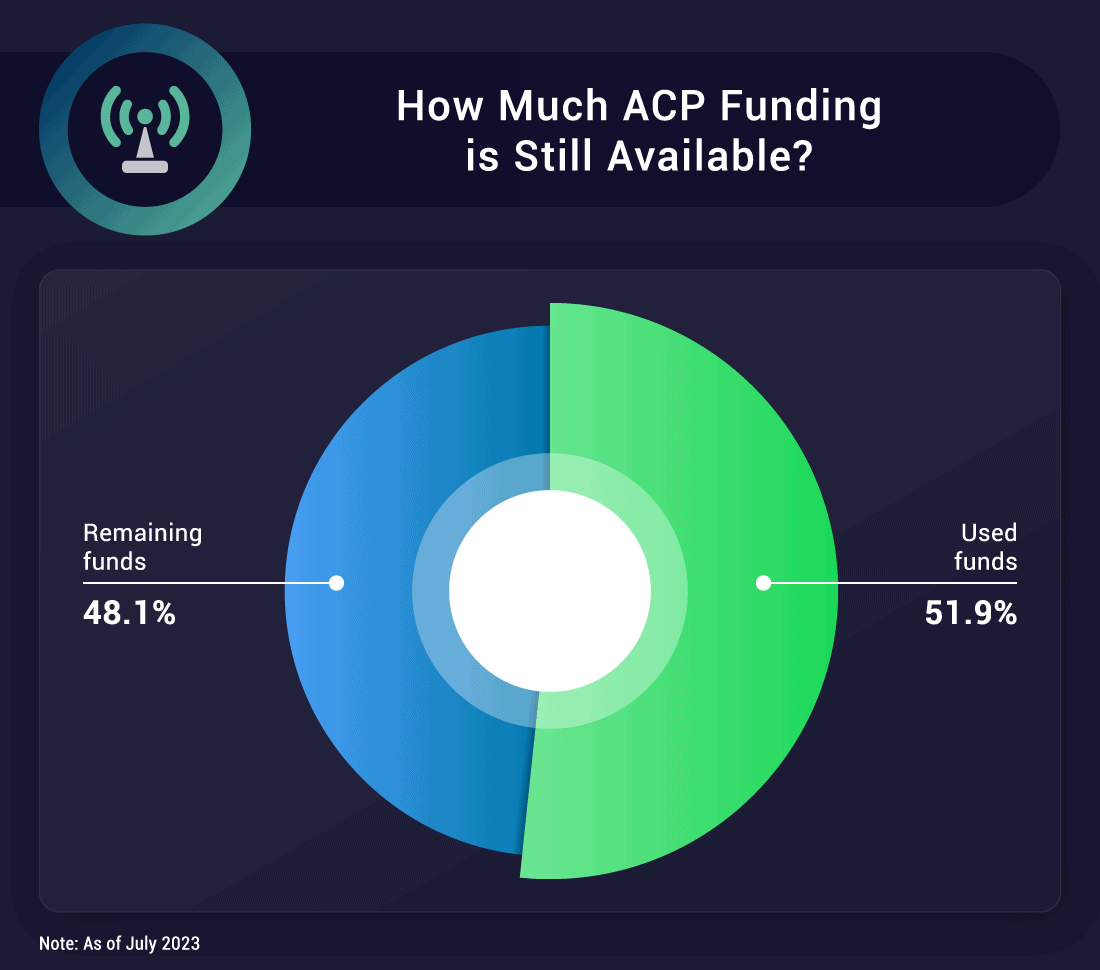
If enrollment from here stagnates, the remaining $8 billion could last up to another 16 months, but if it sustains its current 1.5% growth rate, the program could run out in just half that time without an influx.
Eight months of remaining funding is short enough, but if we were ever to reach full enrollment of our estimated 68 million eligible households, the funds would be gone in less than four months.States currently have a median of 591,471 eligible households that are not enrolled.
That’s a median of up to $18 million in unused funds per month, with some states like California forgoing over 10 times that amount.
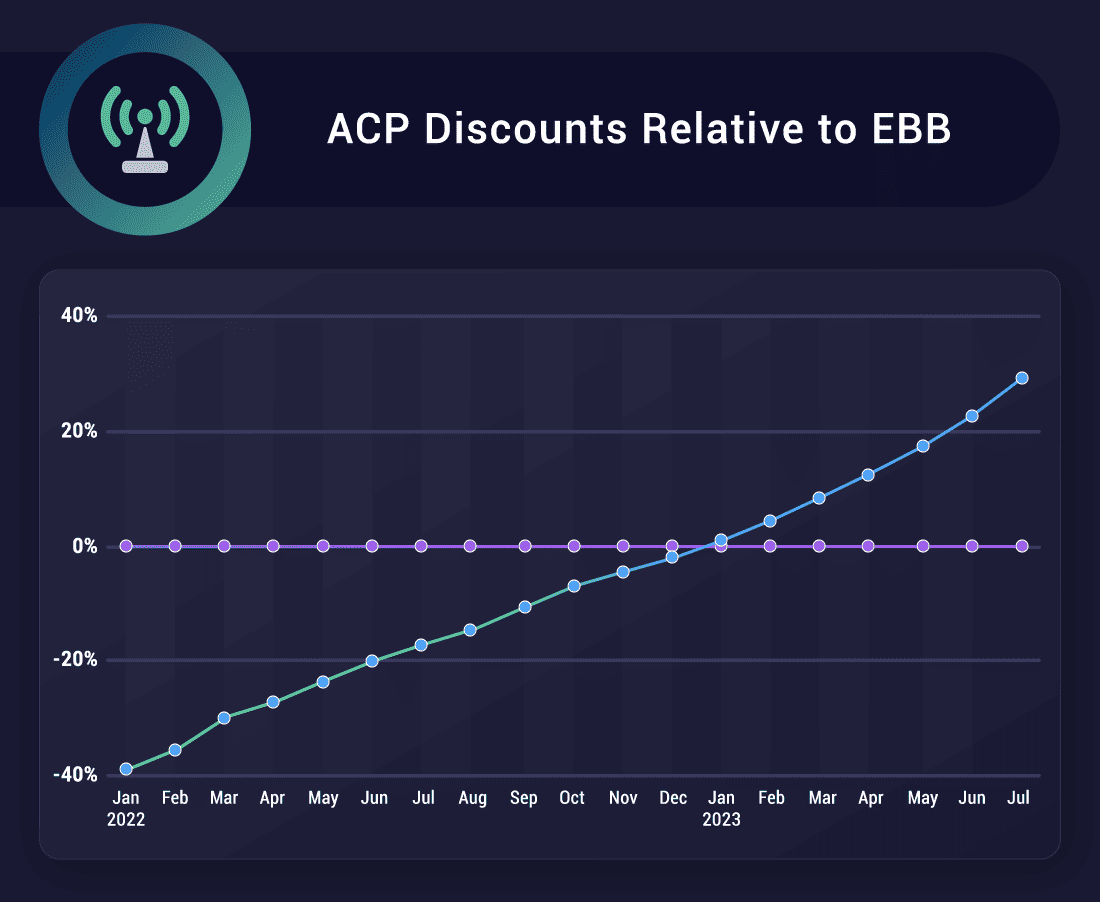
Additionally, although there are many more qualifying households now than under the EBB, since the benefit decreased from a standard of $50 per month per household to a standard of $30 per month per household, there was nearly a year after the ACP started where it was delivering less assistance per month than the EBB was.
Methodology
There are many ways to qualify for the Affordable Connectivity Program, but for the purposes of this study, we estimated the number of eligible households based only on those that verifiably make less than 200% the federal poverty guidelines according to IRS tax return data as this ensures we capture the largest number of eligible households possible. All households who qualify via other means such as through SNAP or by receiving discounts on school lunches are included, without double counting any households.
Those poverty guidelines give a base number for the poverty line in a household with one person, and a number to add for every additional person. Here are the numbers for 200% of the federal poverty line:
Continental
- Base number: $29,160
- Per additional person: $10,280
Hawaii
- Base number: $33,540
- Per additional person: $11,820
Alaska
- Base number: $36,420
- Per additional person: $12,860
Since this metric depends on the number of individuals in each household, we calculated the distribution of household sizes in every state using American Community Survey (ACS) 2021 5-year estimate microdata.
The IRS Statistics of Income (SOI) division publishes individual income tax statistics by zip code every year. This data includes the number of income tax returns that fall into each of 6 different Adjusted Gross Income (AGI) buckets. We assume that one tax return corresponds to roughly one household, as over 95% of married couples file jointly.
AGI Stub
| AGI Stub | Upper limit of AGI |
|---|---|
| 1 | $25,000 |
| 2 | $50,000 |
| 3 | $75,000 |
| 4 | $100,000 |
| 5 | $200,000 |
| 6 | + |
Using the household size distributions, we can estimate the number of returns in each AGI Stub bucket corresponding to each household size. If 200% of the federal poverty guidelines for a given household size is larger than the upper limit of an AGI Stub, then we count all those households as qualifying since the adjusted gross income of their household must be below 200% of the federal poverty guidelines.
This necessarily excludes people who do not file income tax returns, as well as all the households that make below 200% of the federal poverty guidelines for their household size but who happen to be in an AGI Stub with an upper limit above that guideline.
Our method only includes households that verifiably qualify for the program, and therefore it is a conservative underestimate of the true number of households that qualify.
We then compare our estimates for the number of qualifying households at different geographies to the data in the USAC’s ACP Enrollment and Claims Tracker.
The figures comparing ACP discounts to the EBB are intended to highlight the trend. Those figures assume that every enrolled household receives the full standard benefit, ignore that some people may receive a smaller benefit because their bill may be below the benefit amount, and ignore that some people receive enhanced benefits.
We did not use the USAC’s claimed support numbers because “Under ACP rules, providers have up to 6 months to file claims for reimbursement of ACP benefits passed through to households. As a result, monthly totals may adjust as new claims are submitted or as past claims are revised.”
This can lead to inconsistencies in the data, especially in the most recent months. Even though there have never been more people enrolled in the program, the data shows a massive reduction in claimed funding in May likely because of delays in ISPs filing their claims for reimbursements.
Further Reading

Written by