The federal government launched the Emergency Broadband Benefit in February 2021 to provide low-income households with a $50 monthly discount on their internet bill as part of a multi-pronged approach to reduce the digital divide, which is a function of both access to a wired high-speed internet service provider and the affordability of service.
According to the November data from the Universal Service Administrative Co, enrollment in the Emergency Broadband Benefit reached 7.1 million households (up from 6.1 million in October). That is incredible growth, however as many as 30 million additional households likely qualify but are missing out.
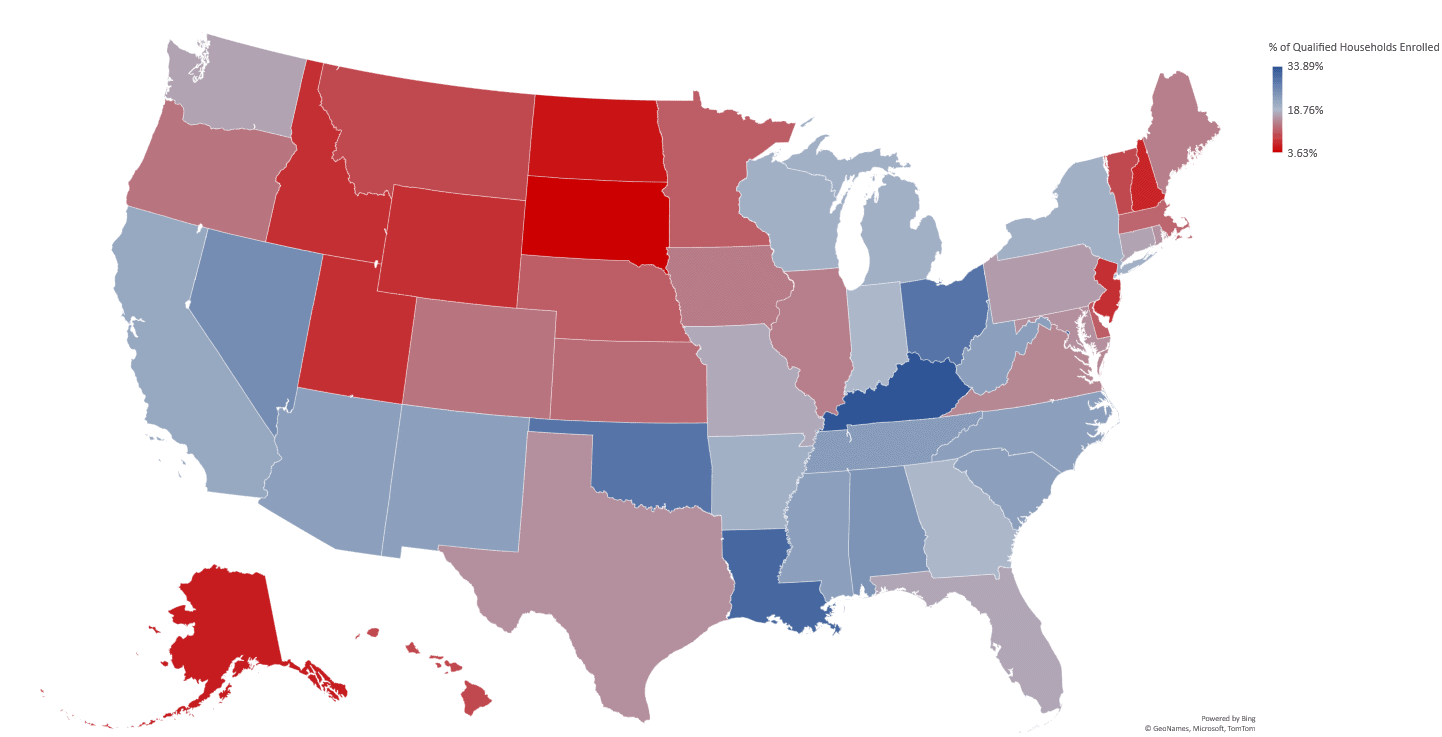
We wanted to understand how and where the EBB is being adopted across the U.S. and found that adoption varies greatly by city, state and region. As an example, qualifying households in Kentucky are 10 times more likely to take advantage of it than those in South Dakota.
Understanding adoption is extremely important as Congress recently passed the Affordable Connectivity Program, which is replacing the EBB in 2022. Households enrolled in the EBB as of 12/31/2021 will continue to receive a monthly discount for a 60-day transition period. Our point of view is that additional marketing of the Affordable Connectivity Program, especially in under-enrolled regions, is the best way to reduce the affordability component of the digital divide.
For this report we estimated the number of qualifying households by zip code and compared it to adoption data released by the USAC. (Full methodology here.)
EBB Adoption by State
There are significant gaps in Emergency Broadband Benefit adoption by state. The chart shows the 5 states in the US that have the lowest enrollment rate compared to estimated qualifying households. Some of the gap is due in part to the availability of wired high-speed internet (Alaska and the Dakotas have lower availability for terrestrial broadband than, say, Washington D.C.). However, New Hampshire has widespread availability of gigabit internet plans (not to mention, slower high-speed plans that meet the federal definition of broadband).
| State | Estimated Qualifying Households | Enrolled Households | Penetration Rate |
|---|---|---|---|
| South Dakota | 51,576 | 3,750 | 3.63% |
| North Dakota | 143,109 | 9,413 | 5.17% |
| Alaska | 84,326 | 5,006 | 5.94% |
| New Hampshire | 66,751 | 3,454 | 6.58% |
| Wyoming | 90,978 | 3,300 | 7.27% |
And these are the 5 best states in the US for EBB enrollment.
| State | Estimated Qualifying Households | Enrolled Households | Penetration Rate |
|---|---|---|---|
| Kentucky | 508,260 | 172,243 | 33.89% |
| Washington, D.C. | 63,133 | 21,371 | 33.85% |
| Louisiana | 550,961 | 171,456 | 31.12% |
| Oklahoma | 411,671 | 120,028 | 29.16% |
| Ohio | 1,382,808 | 401,961 | 29.07% |
The following map shows the percentage of qualified households in each state that are enrolled in the program:
In terms of zip codes, due to privacy concerns, data is not published by USAC for some smaller zip codes. Because of that, we are unable to distinguish between zip codes that have 0% adoption and those that are excluded for privacy reasons. The 5 below zip codes have the worst rate of adoption of all those that have enrolled households.
Some zip codes, like Minot, North Dakota, do not have wired or fixed wireless broadband providers. Other zip codes, like Fair Haven, NJ or Pinedale, Wyoming do have widespread availability according to data from the FCC.
| Zip Code | State | City | Estimated Qualifying Households | Enrolled Households | Penetration Rate |
|---|---|---|---|---|---|
| 58704 | North Dakota | Minot | 552 | 1 | 0.18% |
| 07704 | New Jersey | Fair Haven | 467 | 1 | 0.21% |
| 57706 | South Dakota | Ellsworth | 452 | 1 | 0.22% |
| 88330 | New Mexico | Holloman | 447 | 1 | 0.22% |
| 82941 | Wyoming | Pinedale | 441 | 1 | 0.23% |
The following zip codes—which have 200 or more total estimated households—have perfect or near perfect penetration rates. The total number of enrolled households is similar to the number of estimated qualifying households.
| Zip Code | State | City | Estimated Qualifying Households | Enrolled Households |
|---|---|---|---|---|
| 86547 | Arizona | Round Rock | 82.391 | 239 |
| 41839 | Kentucky | Mousie | 67.638 | 195 |
| 86043 | Arizona | Second Mesa | 207.97 | 566 |
| 86034 | Arizona | Keams Canyon | 237.119 | 601 |
| 74103 | Oklahoma | Tulsa | 141.76 | 345 |
| 86039 | Arizona | Kykotsmovi Village | 186.733 | 437 |
| 86042 | Arizona | Polacca | 186.019 | 435 |
| 85007 | Arizona | Phoenix | 1733.327 | 3725 |
| 86030 | Arizona | Hotevilla | 155.799 | 331 |
| 16501 | Pennsylvania | Erie | 210.884 | 374 |
| 90013 | California | Los Angeles | 1110.14 | 1911 |
| 86514 | Arizona | Teec Nos Pos | 298.987 | 509 |
| 86044 | Arizona | Tonalea | 414.869 | 699 |
| 32202 | Florida | Jacksonville | 468.301 | 702 |
| 87420 | New Mexico | Shiprock | 1435.552 | 2091 |
| 44702 | Ohio | Canton | 109.755 | 159 |
| 14604 | New York | Rochester | 299.344 | 404 |
| 41862 | Kentucky | Topmost | 66.567 | 88 |
| 45203 | Ohio | Cincinnati | 380.008 | 490 |
| 13202 | New York | Syracuse | 774.901 | 992 |
| 61602 | Illinois | Peoria | 118.738 | 151 |
| 06702 | Connecticut | Waterbury | 513.142 | 642 |
| 44103 | Ohio | Cleveland | 2381.861 | 2972 |
| 87416 | New Mexico | Fruitland | 564.279 | 702 |
| 12207 | New York | Albany | 260.498 | 323 |
| 87045 | New Mexico | Prewitt | 285.72 | 353 |
| 44104 | Ohio | Cleveland | 3461.241 | 4274 |
| 95202 | California | Stockton | 805.966 | 993 |
| 44308 | Ohio | Akron | 117.31 | 143 |
| 40202 | Kentucky | Louisville | 754.21 | 912 |
| 41740 | Kentucky | Emmalena | 80.606 | 97 |
| 41666 | Kentucky | Wayland | 81.32 | 97 |
| 43604 | Ohio | Toledo | 1269.851 | 1505 |
| 44127 | Ohio | Cleveland | 691.74 | 811 |
| 90014 | California | Los Angeles | 850.56 | 969 |
| 56566 | Minnesota | Naytahwaush | 66.567 | 75 |
| 44110 | Ohio | Cleveland | 2917.879 | 3283 |
| 90021 | California | Los Angeles | 370.967 | 415 |
| 14204 | New York | Buffalo | 1334.565 | 1490 |
| 40935 | Kentucky | Flat Lick | 257.999 | 288 |
| 44311 | Ohio | Akron | 1088.042 | 1198 |
| 14203 | New York | Buffalo | 223.08 | 244 |
| 41650 | Kentucky | Melvin | 81.32 | 88 |
| 41701 | Kentucky | Hazard | 1435.384 | 1553 |
| 87323 | New Mexico | Thoreau | 406.957 | 438 |
| 74106 | Oklahoma | Tulsa | 2397.59 | 2545 |
| 87312 | New Mexico | Continental Divide | 73.765 | 78 |
| 44115 | Ohio | Cleveland | 1232.171 | 1288 |
| 44108 | Ohio | Cleveland | 3531.507 | 3665 |
| 45214 | Ohio | Cincinnati | 1465.305 | 1518 |
| 41844 | Kentucky | Pippa Passes | 96.073 | 99 |
| 45225 | Ohio | Cincinnati | 1456.868 | 1500 |
| 41843 | Kentucky | Pine Top | 74.122 | 76 |
| 44507 | Ohio | Youngstown | 818.671 | 839 |
| 41314 | Kentucky | Booneville | 473.524 | 485 |
| 98104 | Washington | Seattle | 1323.028 | 1355 |
| 41630 | Kentucky | Garrett | 132.42 | 134 |
| 42647 | Kentucky | Stearns | 429.265 | 431 |
And the following map shows the percentage of qualified households per zip code that are enrolled in the program:
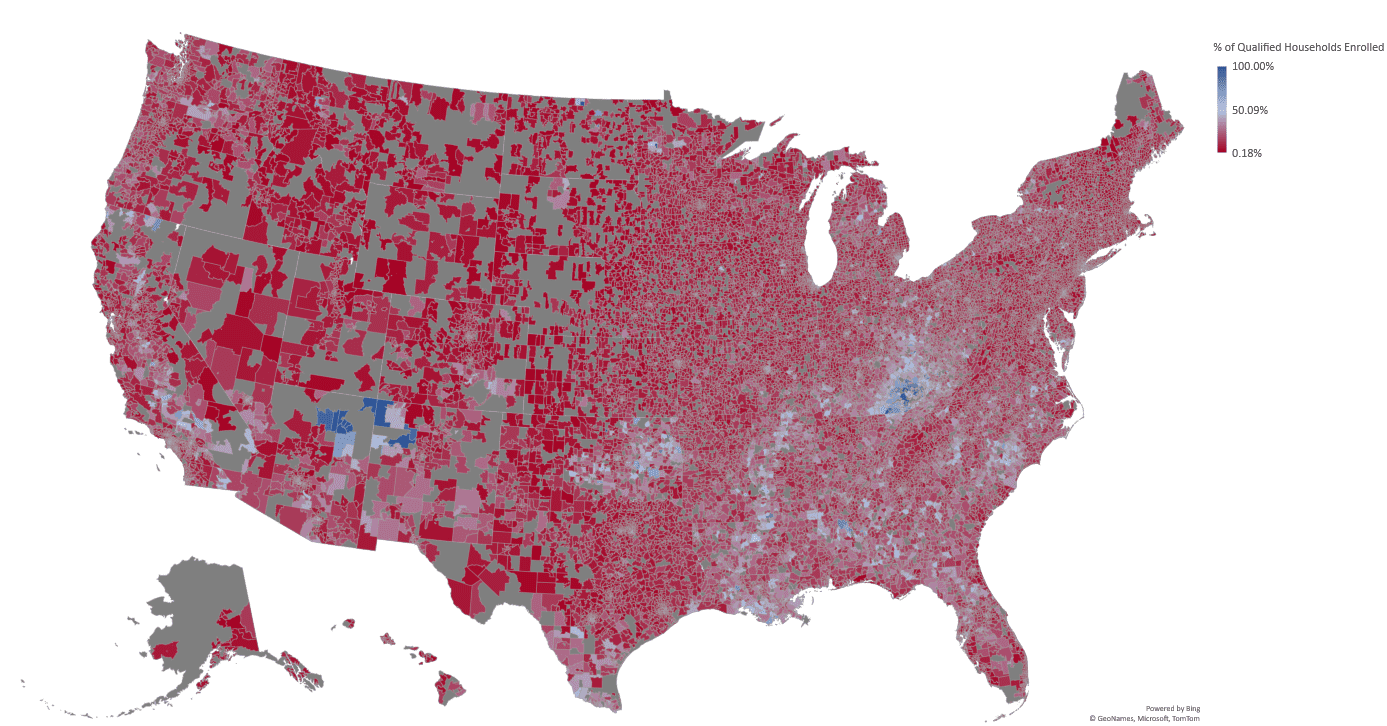
To see how these maps compare to national broadband coverage take a look at our interactive coverage map: https://www.broadbandnow.com/research/national-broadband-map
Finally, below is a list of all states and their ranking for EBB adoption (1st is highest adoption).
| State Code | % of Estimated Qualified Households Enrolled | Rank |
|---|---|---|
| Alabama | 24.42% | 7 |
| Alaska | 5.94% | 49 |
| Arizona | 22.72% | 11 |
| Arkansas | 20.08% | 18 |
| California | 21.34% | 15 |
| Colorado | 13.24% | 34 |
| Connecticut | 16.90% | 24 |
| Delaware | 11.15% | 39 |
| Florida | 17.21% | 23 |
| Georgia | 19.00% | 20 |
| Hawaii | 9.45% | 43 |
| Idaho | 7.52% | 46 |
| Illinois | 14.18% | 31 |
| Indiana | 18.89% | 21 |
| Iowa | 13.72% | 33 |
| Kansas | 12.47% | 36 |
| Kentucky | 33.89% | 1 |
| Louisiana | 31.12% | 3 |
| Maine | 13.86% | 32 |
| Maryland | 15.31% | 29 |
| Massachusetts | 11.74% | 37 |
| Michigan | 20.34% | 16 |
| Minnesota | 11.28% | 38 |
| Mississippi | 22.95% | 9 |
| Missouri | 17.49% | 22 |
| Montana | 9.62% | 42 |
| Nebraska | 11.14% | 40 |
| Nevada | 25.45% | 6 |
| New Hampshire | 6.58% | 48 |
| New Jersey | 7.65% | 44 |
| New Mexico | 22.40% | 13 |
| New York | 20.23% | 17 |
| North Carolina | 22.36% | 14 |
| North Dakota | 5.17% | 50 |
| Ohio | 29.07% | 5 |
| Oklahoma | 29.16% | 4 |
| Oregon | 13.17% | 35 |
| Pennsylvania | 16.33% | 26 |
| Rhode Island | 15.68% | 27 |
| South Carolina | 22.85% | 10 |
| South Dakota | 3.63% | 51 |
| Tennessee | 23.37% | 8 |
| Texas | 15.36% | 28 |
| Utah | 7.55% | 45 |
| Vermont | 9.84% | 41 |
| Virginia | 14.74% | 30 |
| Washington | 16.79% | 25 |
| Washington, D.C. | 33.85% | 2 |
| West Virginia | 22.66% | 12 |
| Wisconsin | 19.99% | 19 |
| Wyoming | 7.27% | 47 |
Conclusion
To encourage more adoption and reduce the digital divide, the federal government should do additional marketing of the Affordable Connectivity Program, which is replacing the Emergency Broadband Benefit in 2022. In particular, states with lower adoption rates should receive higher amounts of marketing.
The Affordable Connectivity Program reduces the monthly benefit from $50 to $30, except for those on Tribal lands, where the benefit remains at $75 per month. The ACP also expands eligibility, moving from 135% of the Federal Poverty Guidelines to 200%.
About our Data & Methodology
Who Qualifies for the Emergency Broadband Benefit?
A household can qualify for the EBB in many ways. Qualification for the FCC’s Lifeline program—which includes having a household income at or below 135% the federal poverty guidelines, living on tribal lands and participating in a qualifying Tribal Assistance program, or having a household member that participates in SNAP, Medicaid, Supplemental Security Income, Federal Public Housing Assistance, or the Veterans and Survivors Pension Benefit—also qualifies the household for the EBB. Receiving a federal Pell Grant for the current year qualifies you. If any member of the household has experienced a substantial loss of income since February 29, 2020, and the household income is at or below $99,000 for single filers or $198,000 for joint filers then they qualify. Households can also qualify if they meet the eligibility criteria for a participating and FCC approved communications provider’s existing low-income or COVID-19 program. Finally, a household can qualify for the EBB if their child receives free or reduced school lunch.
To estimate the number of households per zip code that qualify for the EBB, it is necessary to use a subset of these qualifying criteria because many households will qualify via multiple avenues at the same time. Calculating the number of people who qualify based on each qualifying criteria would double, or triple count some individuals and give an inaccurate estimation. Additionally, data on the number of recipients of some programs is not available on a per zip code or state basis.
Estimating the Number of Qualifying Households per Zip Code.
The IRS publishes aggregate tax statistics per zip code and per income bracket that we can use to estimate the number of households that qualify for the EBB via programs that are based on household income. Specifically, this lets us estimate the number of households that qualify for lifeline (and therefore the EBB) based on having a household income at or below 135% the federal poverty guidelines as well as the number of households that meet the federal income eligibility guidelines for child nutrition programs. The IRS data omits zip codes with less than 100 tax returns in a year, income and tax items with less than 20 returns in a zip code, returns with a negative adjusted gross income, and rounds the number of returns with a particular variable to the nearest 10.
The above two criteria will be the only two that are used to estimate the number of qualifying households in order to avoid double counting households, because data for participants in other programs may not be available, and because many of the programs are administered locally and have different qualifying criteria for every state or locality. Households that qualify for at least one of the above two criteria should account for most households that qualify for the EBB because if a household qualifies based on a different criterion, then they likely also qualify based on the criteria we are including. That said, it is important to acknowledge that our estimate is likely to be conservative since it does not include the other qualifying criteria.
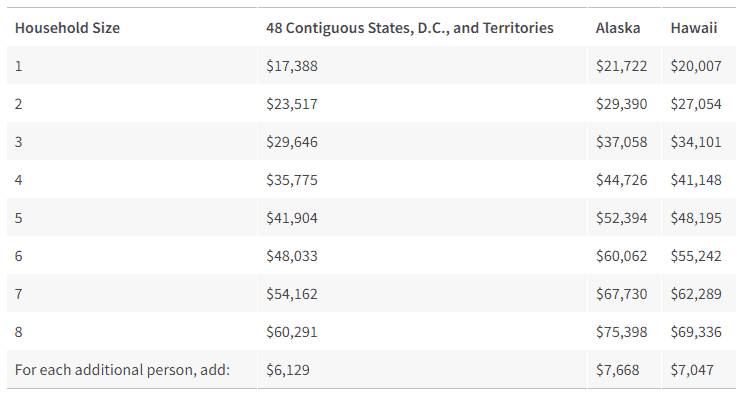
We assume that the number of tax returns in a zip code is roughly equivalent to the number of households in a zip code because over 95% of married couples file jointly (Fishman, 1). Since both criteria we’re using to estimate the number of eligible households are based on the number of people within a household, we will use data from the US Census Bureau that gives the percentage of households with each household size from 1 to 7 or more persons to estimate the number of households of each size per zip code. The below table from the Lifeline website gives the values for 135% the federal poverty guidelines.
The IRS data gives us the number of returns in 6 adjusted gross income brackets per zip code:
- AGI-1 = >$25,000
- AGI-2 = $25,000 – $50,000
- AGI-3 = $50,000 – $75,000
- AGI-4 = $75,000 – $100,000
- AGI-5 = $100,000 – $200,000
- AGI-6 = <$200,000
Based on this data, we will consider any households in AGI-1 (>$25,000) with 2 or more members, and any households in AGI-2 with 6 or more members to qualify if they’re within the 48 contiguous states and DC. The cutoffs for 135% of the federal poverty guidelines are very close for those numbers and minimize the included households that don’t qualify, but unfortunately do not include many people in AGI-1 with a household size of 1 that might qualify. For that reason, this should still be a conservative estimate of qualified households. For Alaskan zip codes we will include any household in AGI-1 and any households in AGI-2 with 5 or more members. For zip codes in Hawai’i, we will include households in AGI-1 with 2 or more members and households in AGI-2 with 5 or more members. That gives us the estimated number of households per zip code that qualify for Lifeline.
Below are the federal guidelines for Child Nutrition Programs reduced lunch.
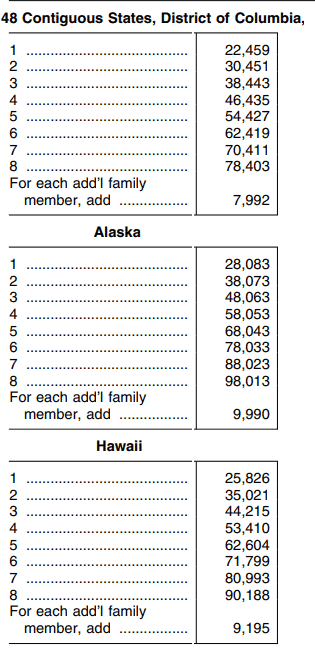
From this we can see that the federal guidelines for Child Nutrition Programs reduced lunch are less strict than the 135% federal guidelines required for Lifeline. The IRS data also gives us data on the number of tax returns which claimed the child and other dependent care credit (N07180) in each AGI group per zip code. In the 48 contiguous states and DC we can safely count any households that claimed the credit that are in AGI-1 with household size of 1 as qualifying for the EBB without double counting anyone since we didn’t include any households of size 1 in our Lifeline estimate, as well as any households that claimed the credit in AGI-2 with household size 5. In Alaska we will count any households in AGI-2 that claimed the credit with household size of 3 or 4 and households in AGI-3 that claimed the credit with household size of 6 or more. In Hawai’i we will include households that claimed the credit in AGI-1 with household size 1, households that claimed the credit in AGI-2 that claimed the credit with household size 4, and households that claimed the credit in AGI-3 with household size 6 or more.
By adding together our estimates for households that qualify via Lifeline and households that qualify via reduced lunch, we get our estimate for total households per zip code that qualify.
We are keeping in mind that our estimated number of qualifying households in the United States, both total and per zip code, is a conservative estimate because we did not include every way that a household can qualify, because even within the criteria we did explore we had to omit some households (Such as households in AGI-1 with one person that are in the contiguous 48 and DC), and because privacy provisions at the IRS omit some data for tax returns from households that would qualify.
Sources
- IRS
https://www.irs.gov/statistics/soi-tax-stats-individual-income-tax-statistics-2018-zip-code-data-soi - Child Nutrition Programs Eligibility guidelines
https://www.govinfo.gov/content/pkg/FR-2018-05-08/pdf/2018-09679.pdf - Stephen Fishman, JD
https://www.nolo.com/legal-encyclopedia/should-married-people-always-file-jointly.html - EBB enrollment numbers
https://www.usac.org/about/emergency-broadband-benefit-program/emergency-broadband-benefit-program-enrollments-and-claims-tracker/

Written by