While broadband access may have been considered a luxury in the past, it is now widely considered an essential service in the modern era, like water or electricity. High quality broadband access is necessary for participating in the digital economy and taking advantage of the many opportunities that the internet provides.
Unfortunately, it is also prohibitively expensive for many Americans. Worse still, it appears that those in low income communities end up paying more than those in high income areas.
Data for this report comes from public and private plan and coverage data from more than 2,000 internet service providers in 2022. “Broadband” in this report is defined as any connection which offers at least 25 Mbps download and 3 Mbps upload speed. View our related 2019 study here.
Key Findings
- Average household income is a strong predictor of broadband pricing, with those in high income areas paying less on average for broadband than those in low income areas.
- This likely also serves to illustrate an increased rate of local broadband competition between providers in high income areas, which tend to be more densely populated than lower income areas.
- There are currently ten states in the U.S. where less than half of the population has access to a low-priced broadband plan of $50 or less per month. The states are Mississippi, Arkansas, Missouri, New Mexico, Montana, Kansas, South Dakota, North Dakota, Alaska, and Wyoming.
- Four states – Delaware, Hawaii, Connecticut, and Washington D.C. – have achieved 100% availability as of 2022.
Access to low-priced broadband by median income
As illustrated in the graph below, the lowest broadband prices are broadly present in the highest income states around the United States.
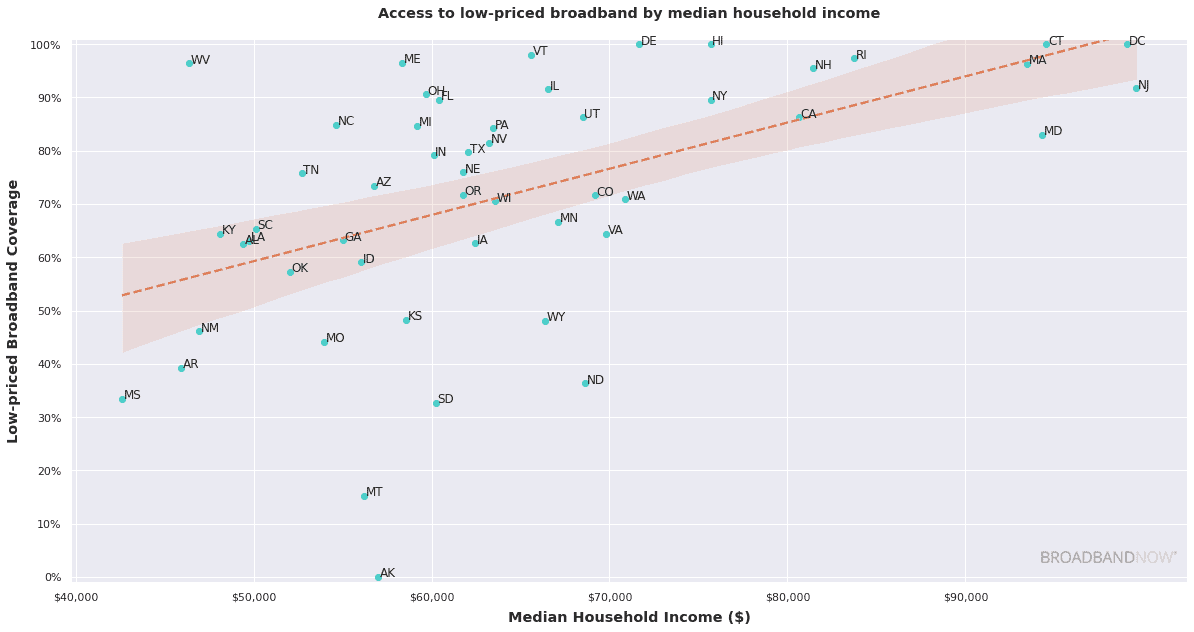
For instance, in New Jersey, where the average household income is nearly $100,000 per year, just over 90% of the population have access to a low-priced broadband plan (read: one costing less than $50 per month). Meanwhile, in the lowest-earning state of Mississippi, only 33% of the population has access to the same price point.
Of course, income level is not the only factor that plays into the affordability of broadband services. This trend is likely due to a variety of factors, such as local economic conditions, state-level infrastructure differences, and the wider urban/rural divide present in the U.S. as a whole. Local competition between providers in particular has been shown to decrease prices and increase speeds on average.
Low-priced broadband access by state
As made evident in the visual below, states vary significantly when it comes to levels of access to a broadband plan priced $50 or lower.
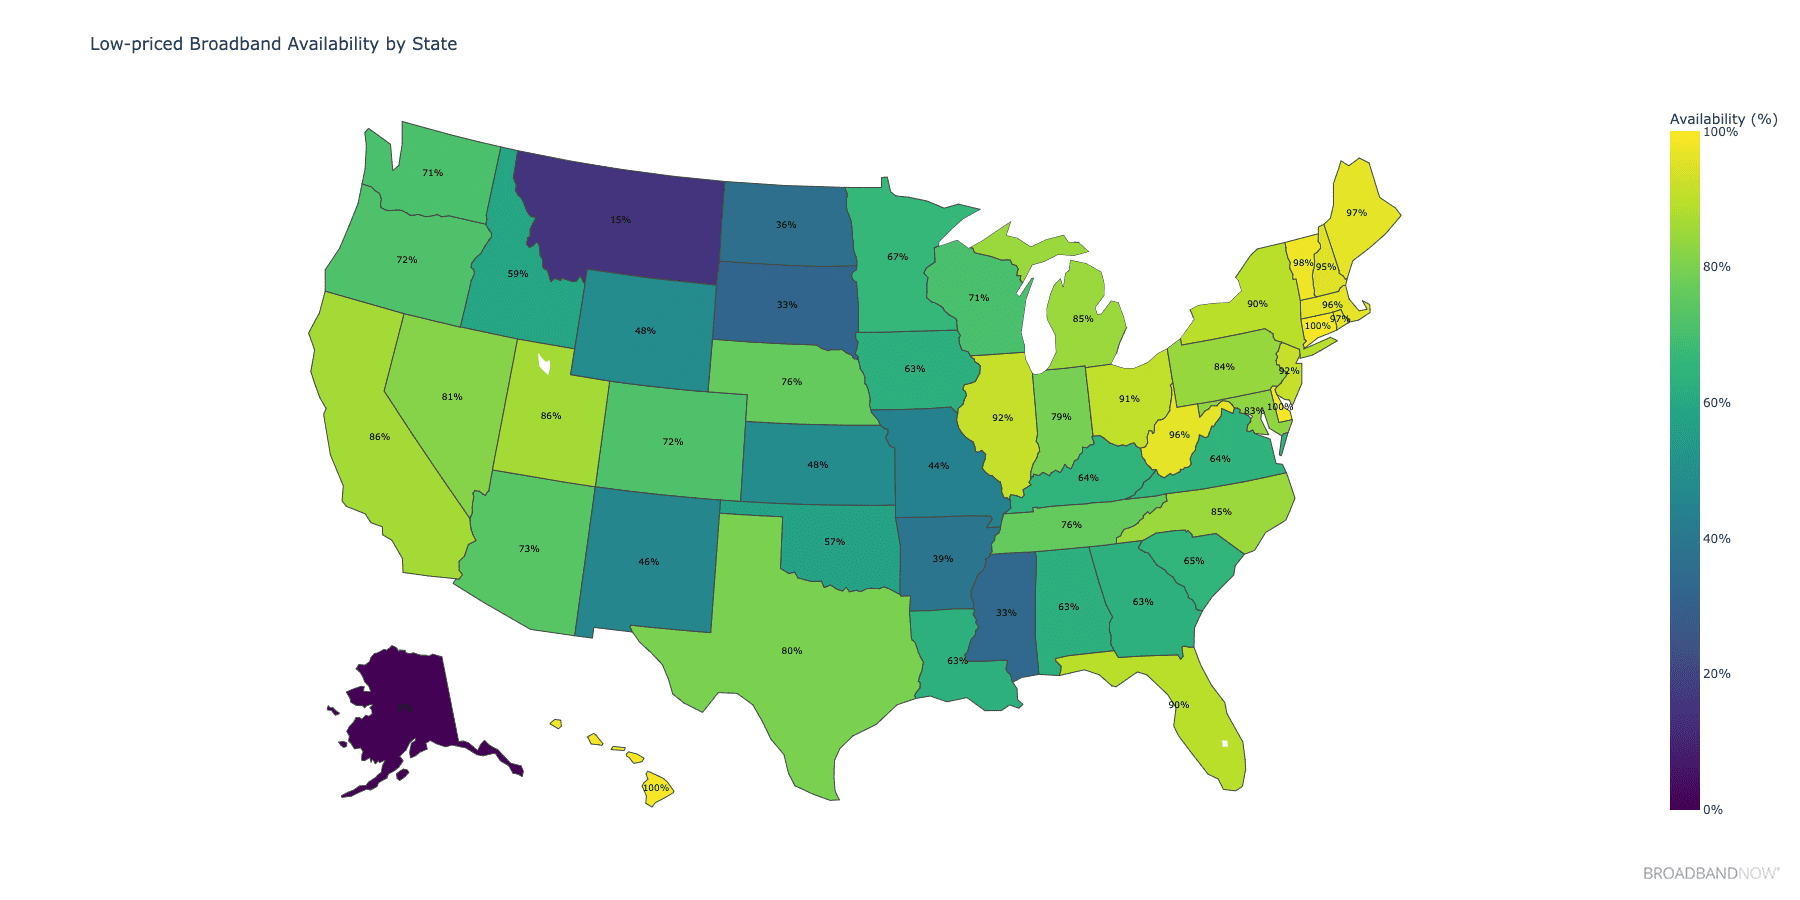
There are ten states that fall below 50% low-priced broadband availability. Conversely, small states and those with high rates of urbanization make up the vast majority of those that have at least 85% access to a low-priced plan.
This analysis does not consider the speeds these plans provide, aside from requiring that the connections offer at least 25 Mbps download and 3 Mbps upload. As the federal government continues to support efforts to bridge the digital divide like the Affordable Connectivity Program and the upcoming BEAD grants, it is vital to understand which states have seen success with rolling out equitable broadband services, and which have had persistent challenges.
Income disparities
There are several factors that can affect a state’s average household income, and these can vary in importance depending on the state. Some of the most common reasons for variations in household income include differences in the local economy, the availability of job opportunities, the cost of living, and the education level of the population. For example, states with strong economies and a high concentration of well-paying jobs are likely to have higher average household incomes, while states with weaker economies or a lower concentration of well-paying jobs may have lower average household incomes.
Additionally, states with a high cost of living may have lower average household incomes, even if they have strong economies, because people need to earn more money to afford the same standard of living. Finally, states with a higher percentage of highly educated residents are likely to have higher average household incomes, because education is often correlated with higher earnings.
Understanding the persistent digital divide
The digital divide refers to the gap between individuals, households, businesses and geographic areas that have access to modern information and communication technologies (ICTs), and those that do not, or have limited access. In the United States, the digital divide has been a persistent issue, with some groups having greater access to technology and the internet than others.
This divide goes beyond affordability as well. Prior research by our team and other organizations has shown that lower-income and rural communities are less likely to have physical access to high-speed internet and advanced technology than their urban and wealthier counterparts. This means that some individuals and communities may not have access to the same educational, economic, and social opportunities as those who do have access to technology.
Additionally, the digital divide can also be seen in terms of age and race. Older adults and certain racial and ethnic minorities are less likely to have access to, or be proficient in, technology and the internet. This can put them at a disadvantage when it comes to accessing information and resources, participating in the digital economy, and staying connected with their communities.
Overall, the digital divide in the United States is a complex issue with many contributing factors. Addressing the divide will require a combination of policies and initiatives aimed at increasing access to technology and closing the gap between those who have access and those who do not. This divide can have significant consequences, as people without access to the internet and other digital technologies may be at a tangible disadvantage when it comes to education, job opportunities, and other areas of life.
About the data
Data for this report comes from publicly available plan and coverage data from more than 2,000 internet service providers in 2022. “Broadband” in this report is defined as any connection which offers at least 25 Mbps download and 3 Mbps upload speed.
Low-priced plan coverage was based on what providers have reported on their most recent FCC Form 477 submission at the census block level. If a provider has indicated that they have coverage in a given census block, we assume that all of the provider’s national plans are also available in that block, as well as any regional plans serving those blocks. Plan pricing is based on the regular monthly rate offered by standalone internet plans. Promotional rates are only considered if that is the only advertised price publicly available.