This report is part of our ongoing, quarterly look at affordable, reliable broadband internet in America. Each quarter we report on wired broadband availability and broadband pricing at the national and local level.
From Q3 to Q4, we observed an increase in the availability of affordable broadband plans. We believe that some of this can be attributed to the holiday shopping season (e.g. Black Friday and Cyber Monday). In addition, we updated and improved our pricing methodology to include regional prices for many large ISPs.
With respect to speeds, little has changed at the end of the year since the major FCC provider coverage update that occurred in Q3. That said, we did note some modest gains in the population with access to basic broadband-level internet as well as in the 100 Mbps speed class. The higher speed class’ market penetration stayed relatively static quarter over quarter.
Data Improvements
As part of our Q4 report, we have expanded our data collection and analysis, as well as updated our methodology for calculating low-priced internet plan access by including regional pricing for national internet service providers, where available. Our data collection team has worked diligently to compile the more granular information than ever, including national providers’ regional variability in plan pricing. As before, we are using the regular monthly price and not limited-time promotional pricing when calculating this metric.
The State of Digital Inclusion
Percentage of Each State with Access to Affordable Internet
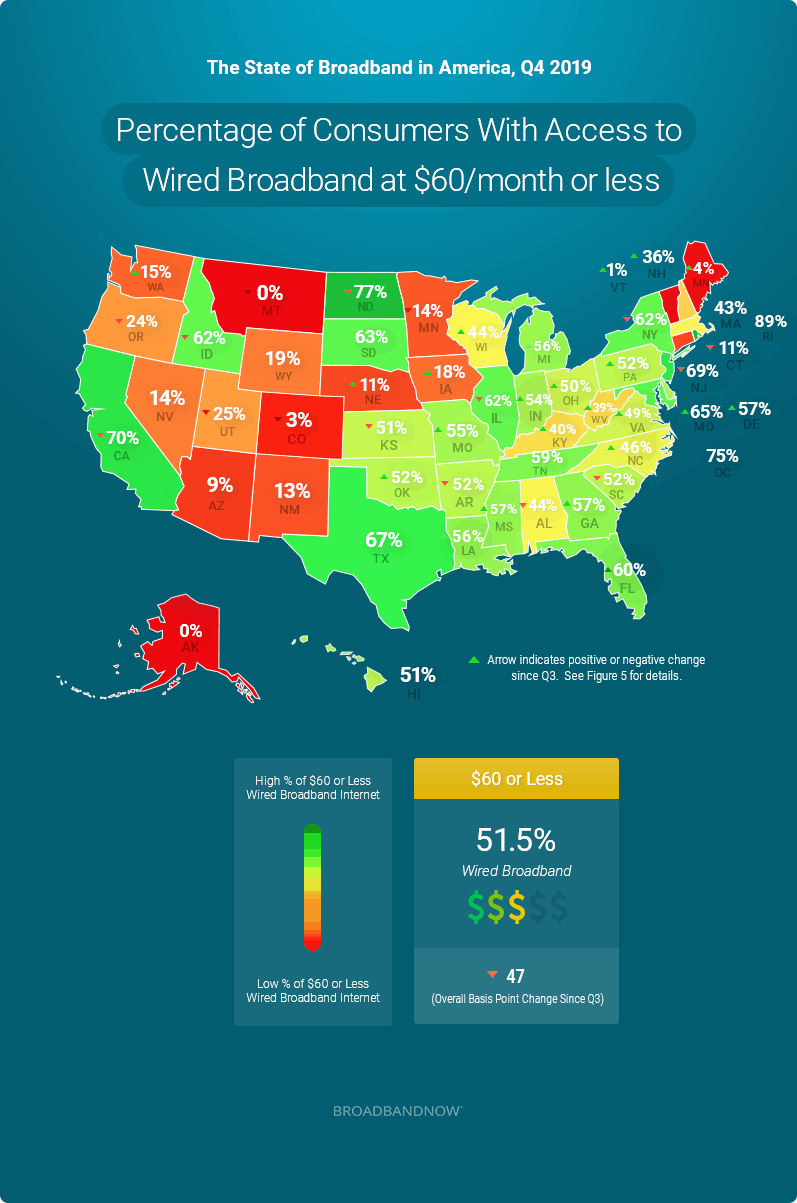
- New Hampshire, Mississippi, Maryland, and Pennsyvlania had the largest increases in accessibility quarter-over-quarter to affordable wired internet priced $60 or less.
- The states with the largest decrease in access to affordable $60 and under stand-alone internet plans were Connecticut, New Jersey, New York, and South Carolina.
Percentage of Each State with Access to High Speed Internet
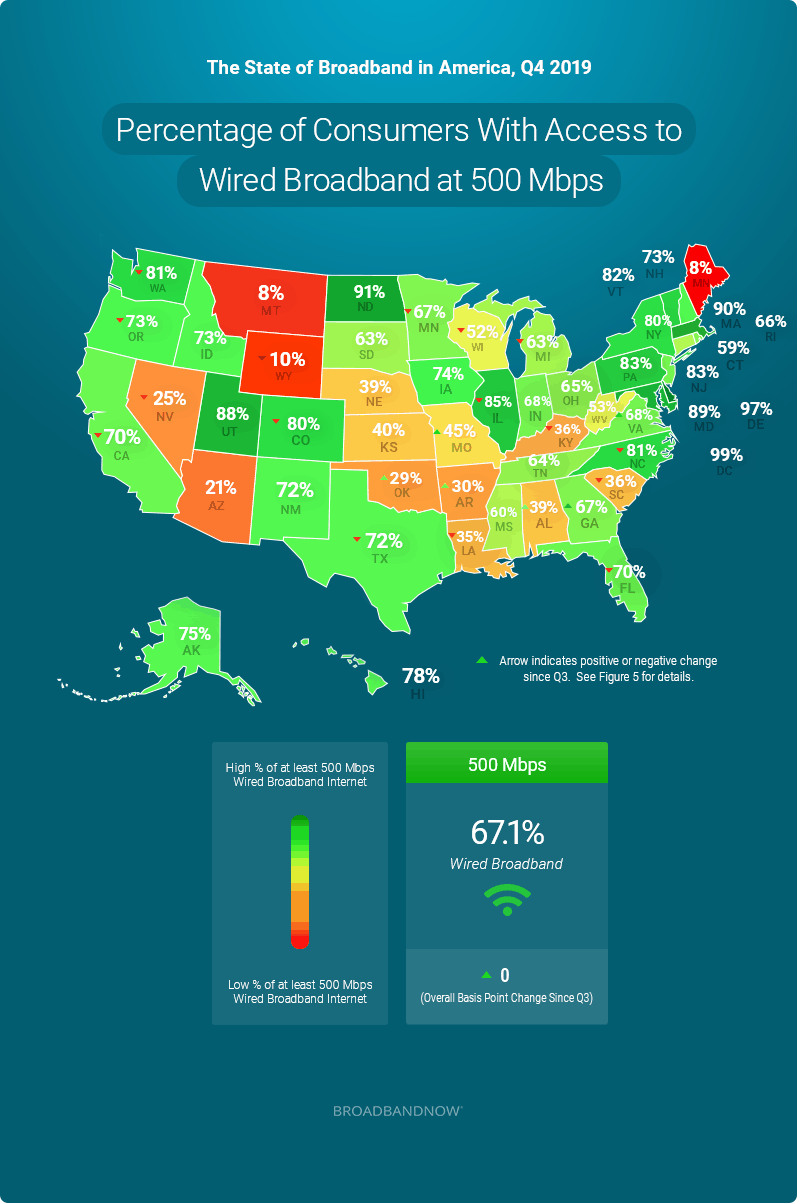
- The states with the largest increases were Oklahoma (90 BPS), Alabama (27 BPS), and Missouri (13 BPS). 8 additional states had very small gains as well.
- However, those gains were offset by losses in other states: Nevada (-69 BPS), Texas (-7 BPS), and California (-2 BPS) all had their population with access drop. There were 14 other states with very minor decreases.
- There has been comparatively minimal movement in the percent of the population with high-speed wired access since the last major FCC update that happened at the end of Q3. 21 states and Washington DC saw no change.
Percentage of the U.S. Population with Access to Low Priced Wired Broadband
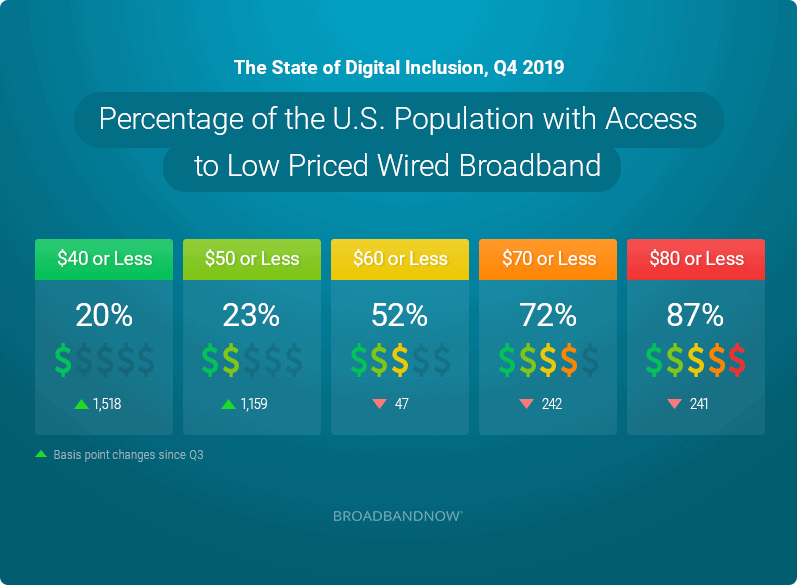
- There was a shift in Q4 towards more affordable prices. The percent of the population with access to $50 and under stand-alone internet plans grew the most. In Q3 access was only 11.5%, which doubled to 23% in Q4.
- Significant gains were also found in access to $40 and under stand-alone internet plans. We saw a significant jump in this category from under 5% of the population having access to now 20%.
- Beyond holiday deals, a big reason for this increase in access to lower priced plans may involve our data optimization, as well as our efforts to include regional plan pricing, which went into effect in this report.
Percentage of the U.S. Population with Access to High Speeds
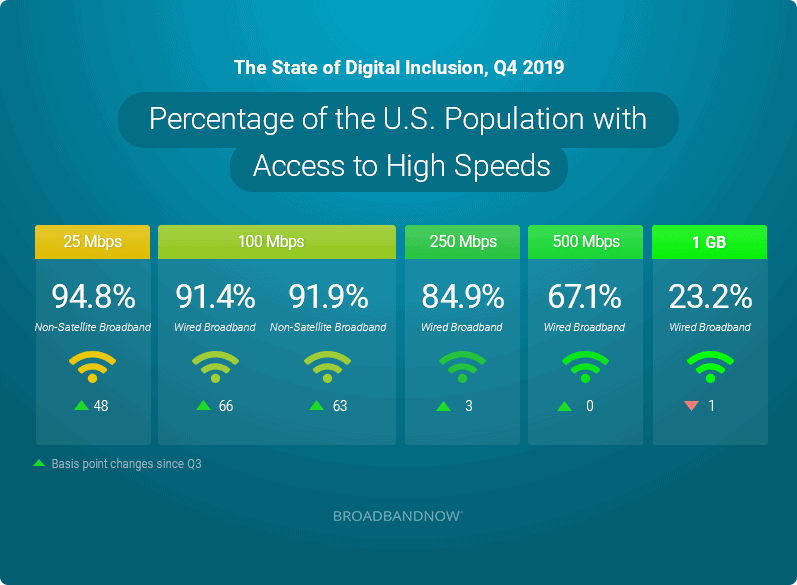
- Netting out these gains and losses we saw at the state level, compared to our Q3 report, 5.5 thousand more consumers had access to 500 Mbps or faster wired broadband internet
- In Q4 we saw increases to both access to basic broadband speed internet as well as access to the 100 Mbps speed class.
- 1.5 million Americans had basic broadband-level internet (via either a wired or fixed wireless connection) become available in their census block that were not available previously.
- The speed class that saw the largest gain in population access was 100 Mbps, specifically in wired technologies. The states that had the biggest percentage increase were the same states that also increased the most at the 500 Mbps level: Arkansas, Mississippi, and Oklahoma.
- While in Q3 there was an overall increase in accessibility to ultra-fast internet (500 Mbps or faster), said gains have since stabilized during Q4.
Notable Developments in Broadband, Q4
Low Earth Orbit Enters the Next Stage
Low-Earth orbit satellite internet is an exciting prospect for rural users that are currently dealing with a lack of robust broadband availability. SpaceX, one of the major companies planning to offer the service, is planning on launching as many as 42,000 satellites over the next several years, but in Q4 2019, the company’s initial timeline was laid out more clearly than ever before, with commercial services potentially being prepped for launch in 2020.
The company currently has 175 operational satellites in low orbit for its ‘Starlink’ service, and plans to launch 120 per month in 2020. This means that the company would reach the 800-satellite milestone Elon Musk mentioned being necessary to start providing “moderate” internet coverage for consumers in North America.
With several additional companies scheduled to conduct test launches in the coming months, we expect 2020 to be a noteworthy year in the nascent field of next-gen, low-latency satellite broadband.
China Nears 100 Percent Fiber Deployment, While the U.S. Lags Behind
China has continued to make impressive progress on building out a robust, nationwide fiber network throughout 2019. 86 percent of the population is now serviced by a fiber connection, whereas the U.S. is currently sitting at 25 percent.
Almost all of China’s internet “backbone” is state-owned, with private providers being limited to leasing out bandwidth from the government. This control over the infrastructure has played a pivotal role in its expedient rollout, with the country investing billions of dollars into the project over the past two decades.
5G Rollouts Continue to Expand Despite Infrastructure Concerns
Legislation that would authorize government spending of more than $1 billion to fund an alternative 5G technology to Huawei’s was proposed in Q4 of last year. The Utilizing Strategic Allied (USA) Telecommunications Act would direct the Federal Communications Commission to spend at least $750 million or up to 5 percent of annual auction proceeds from new auctioned spectrum licenses to create an open-architecture model (O-RAN) research and development fund.
Despite this proposal (and the security fears that inspired it), three major players are already operating infrastructure at-scale in the U.S.: Nokia, Ericsson and Samsung Networks. In addition, Huawei has offered to license their 5G small cell technology to the U.S. in a completely independent manner.
Broadband 2020: The Decade in Review
As part of our continued investigation into the state of broadband in the United States, we’ve issued a new research release detailing infrastructure, policy and technological changes from 2010 to now. We’ve also taken a look out over the next 10 years, projecting how new technologies and sharpened deployment strategies might change the course of the broadband industry in the 2020’s.
You can read the full report here.
Figure 5:
| State | Percentage of the Population with Access to $60 Wired Broadband | Basis Points Change Q3 – Q4 | Percentage of the Population with Access to at least 500 Mbps of Wired Broadband | Basis Points Change Q3 – Q4 |
|---|---|---|---|---|
| Alabama | 44.4% | -6 | 38.7% | 27 |
| Alaska | 0.0% | – | 75.2% | – |
| Arizona | 8.7% | – | 20.8% | – |
| Arkansas | 52.3% | -24 | 29.8% | 21 |
| California | 70.0% | -7 | 69.6% | -2 |
| Colorado | 3.0% | -9 | 80.4% | -2 |
| Connecticut | 10.7% | -1,628 | 59.5% | – |
| Delaware | 57.1% | 51 | 96.8% | – |
| District Of Columbia | 74.7% | – | 98.9% | – |
| Florida | 59.8% | 33 | 70.1% | -2 |
| Georgia | 57.4% | -20 | 66.6% | 5 |
| Hawaii | 51.3% | – | 78.0% | – |
| Idaho | 62.3% | -44 | 72.6% | – |
| Illinois | 62.2% | -10 | 84.9% | -1 |
| Indiana | 53.9% | 53 | 68.2% | 0 |
| Iowa | 17.2% | 67 | 73.9% | 0 |
| Kansas | 51.1% | -13 | 39.8% | 0 |
| Kentucky | 39.6% | 57 | 35.8% | -9 |
| Louisiana | 56.5% | – | 34.9% | -5 |
| Maine | 4.5% | 257 | 8.0% | – |
| Maryland | 65.4% | 403 | 89.1% | – |
| Massachusetts | 43.3% | – | 89.6% | – |
| Michigan | 56.3% | 41 | 62.9% | -1 |
| Minnesota | 13.6% | -210 | 66.6% | -2 |
| Mississippi | 56.8% | 728 | 60.5% | 0 |
| Missouri | 55.3% | 20 | 44.9% | 13 |
| Montana | 0.2% | -49 | 8.4% | – |
| Nebraska | 10.8% | 71 | 39.1% | – |
| Nevada | 13.6% | – | 25.0% | -69 |
| New Hampshire | 36.4% | 1,202 | 72.8% | – |
| New Jersey | 69.3% | -764 | 83.4% | – |
| New Mexico | 12.5% | – | 72.4% | – |
| New York | 62.3% | -725 | 79.9% | – |
| North Carolina | 46.3% | 100 | 80.6% | -2 |
| North Dakota | 76.8% | -88 | 91.4% | – |
| Ohio | 49.6% | 204 | 65.3% | 0 |
| Oklahoma | 52.4% | 63 | 29.1% | 90 |
| Oregon | 24.5% | -71 | 72.9% | -2 |
| Pennsylvania | 51.6% | 345 | 83.5% | 0 |
| Rhode Island | 88.5% | – | 66.4% | – |
| South Carolina | 52.4% | -530 | 36.3% | -13 |
| South Dakota | 63.2% | – | 62.6% | – |
| Tennessee | 59.4% | – | 64.3% | 0 |
| Texas | 67.3% | – | 71.6% | -7 |
| Utah | 25.5% | -2 | 88.3% | – |
| Vermont | 1.1% | 2 | 82.3% | – |
| Virginia | 48.8% | 136 | 68.5% | 7 |
| Washington | 15.4% | 5 | 81.1% | -1 |
| West Virginia | 39.3% | 205 | 52.9% | – |
| Wisconsin | 44.2% | 48 | 51.6% | -3 |
| Wyoming | 19.3% | -458 | 9.6% | -3 |
About our Data
Data for the Q4 BroadbandNow Quarterly Broadband Report comes from publicly available plan data from more than 2,000 internet service providers in Q4 of 2019. We defined broadband internet as a residential provider plan with at least 25 Mbps download and 3Mbps upload speeds, wired broadband as all cable, fiber, and DSL technologies, and non-satellite broadband as cable, fiber, DSL, and fixed wireless technologies. Coverage was based on what providers have reported on their most recent FCC Form 477 at the census block level. If a provider has indicated that they have coverage in a given census block, we assume that all of the provider’s national plans are also available in that block, as well as any regional plans serving those blocks. Plan pricing is based on the regular monthly rate offered. Promotional rates are only considered if that is the only advertised price publicly available.
*Basis Points: in this report, a 1% change = 100 basis points.
Update to Report
2/28/2020
In the process of adding regional pricing to our analysis, we overstated access to low-priced internet plans in certain areas where broadband speeds were not available. This impacted 29 states and changed overall access form 61% to 52%. The other 22 states, including DC, saw either no change or a variance that was not material. Data has been updated throughout the report to reflect these changes.