Impact of Telecommuting, “Shelter in Place” on Home Internet Connections
As Americans across the nation continue to adapt to working and learning remotely, internet providers are also adjusting to this new reality. We have been studying network performance in the U.S. over the past several weeks as more and more Americans are confined to their homes amid the coronavirus pandemic.
Last week, we released a report looking into how networks were holding up in the top 10 U.S. cities by population. This week, we’ve expanded our analysis to the top 200 cities to better understand how this shift may be affecting users in all corners of the country.
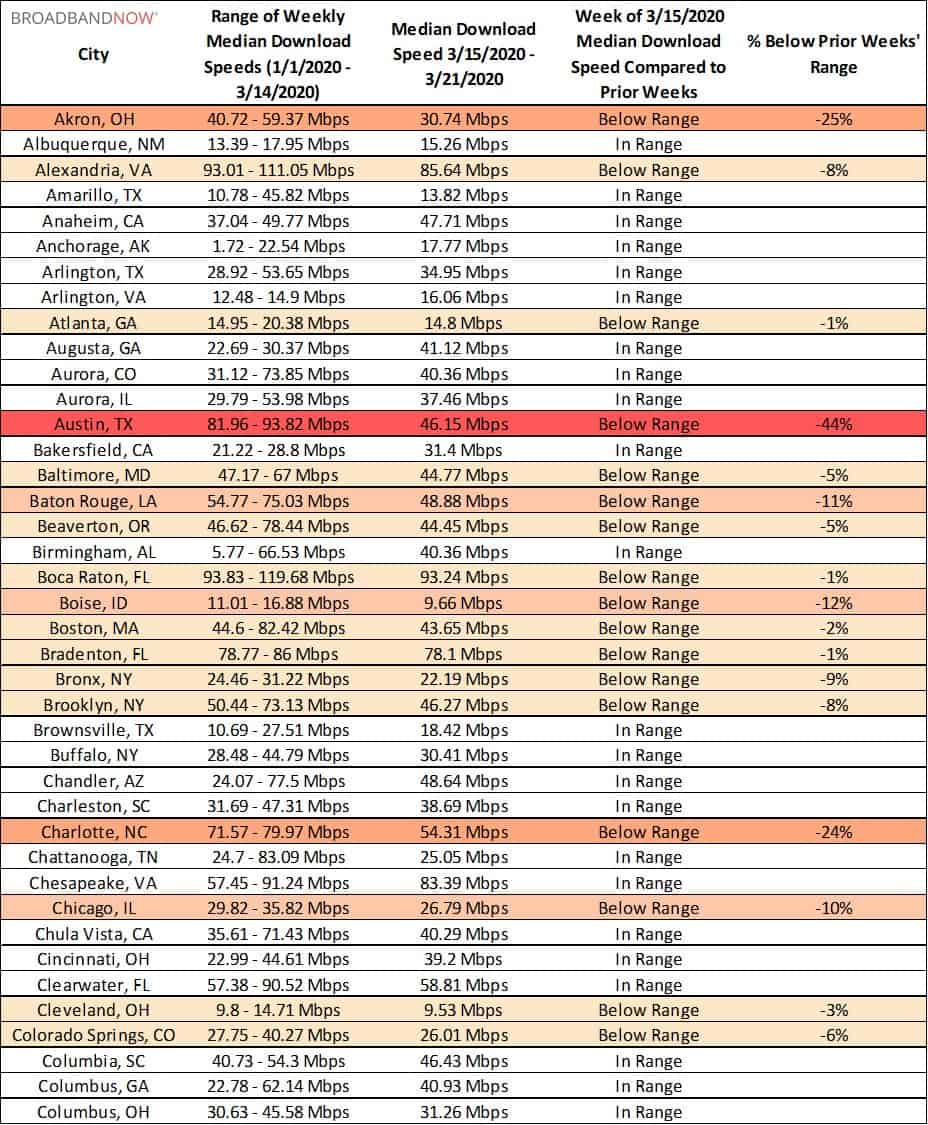
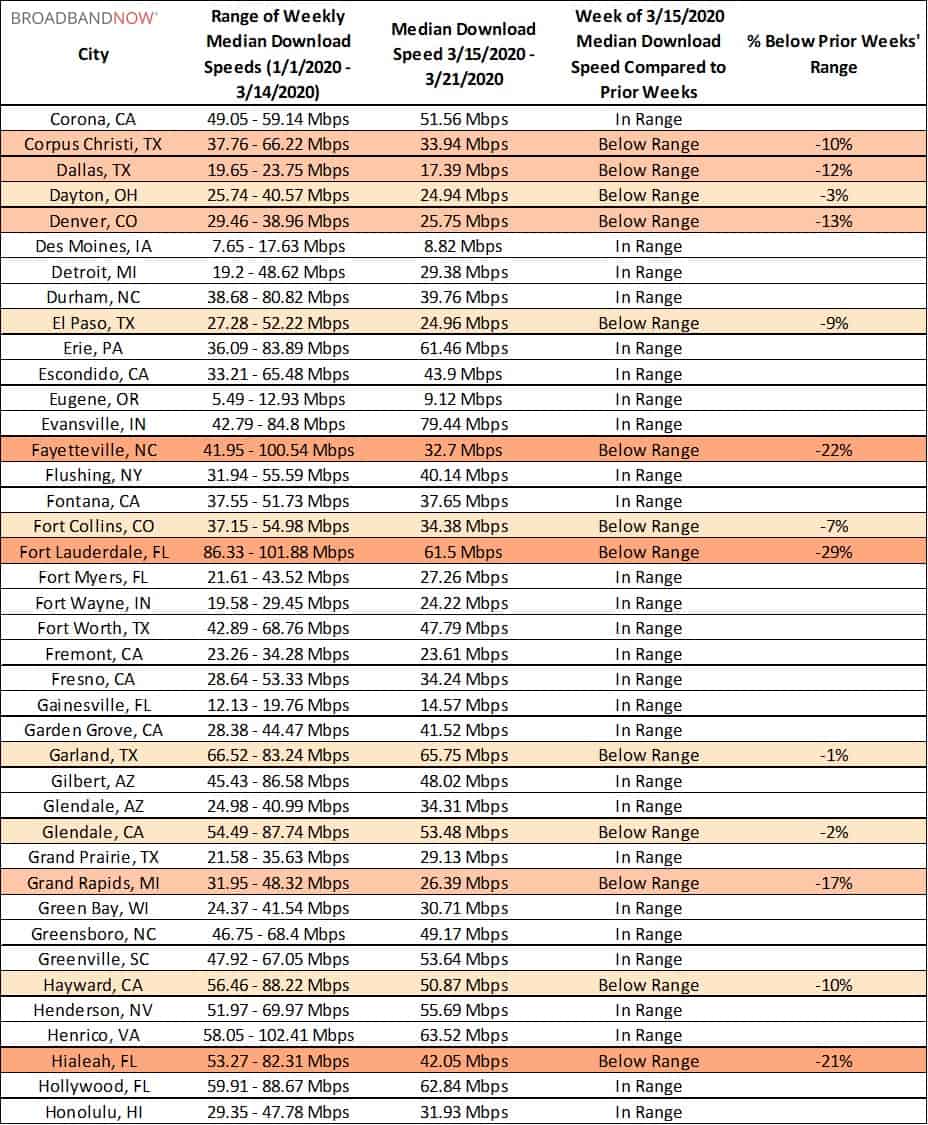
We’ve compared the median download speeds internet users experienced for the week of March 15 to March 21 to the range of speeds experienced in prior weeks of 2020.
Here is where you can test your internet connection’s speed or identify how much internet speed your household needs to support your online activities.
Key Findings
- Users in most of the cities we analyzed should be experiencing normal network conditions, suggesting that ISP’s (and their networks) are holding up to the shifting demand.
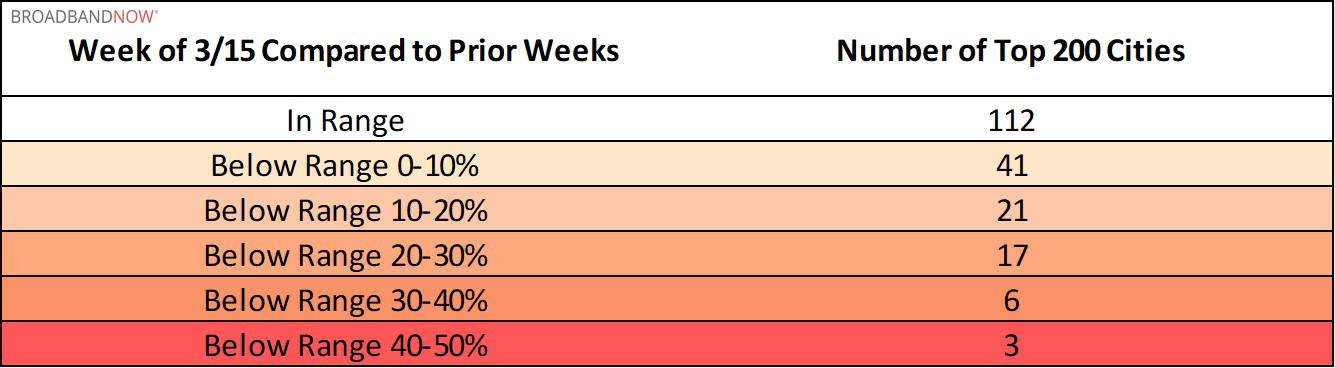
- Eighty eight (44%) of the 200 cities we analyzed have experienced some degree of network degradation over the past week compared to the 10 weeks prior. However, only 27 (13.5%) cities are experiencing dips of 20% below range or greater.
- Download speeds from internet service providers in Seattle have continued to hold up over the past week, while speeds of New York City internet providers have fallen out of range by 24%. Both cities are currently heavily affected by the coronavirus pandemic.
- Internet service in Austin, Texas, Winston Salem, North Carolina, and Oxnard, California have experienced significant degradations, falling out of their ten-week range by more than 40%.
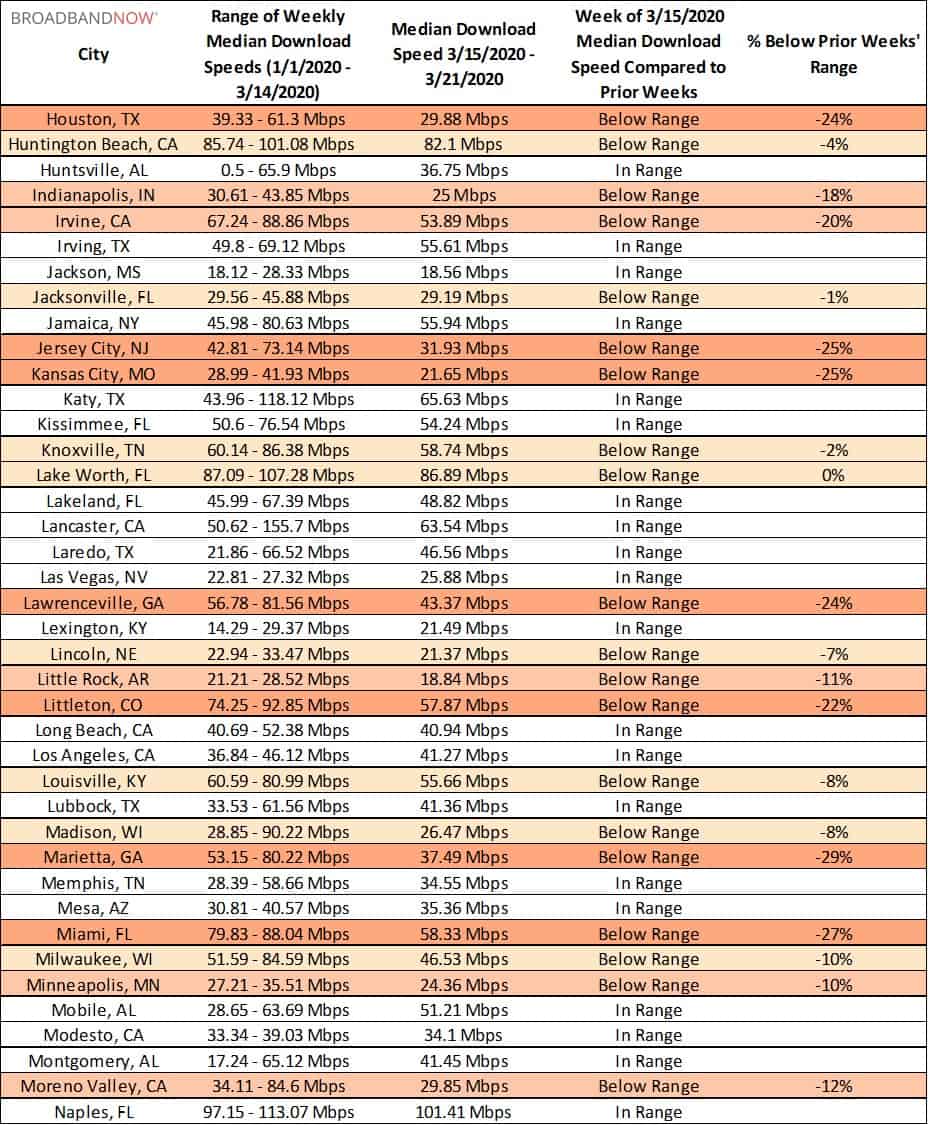
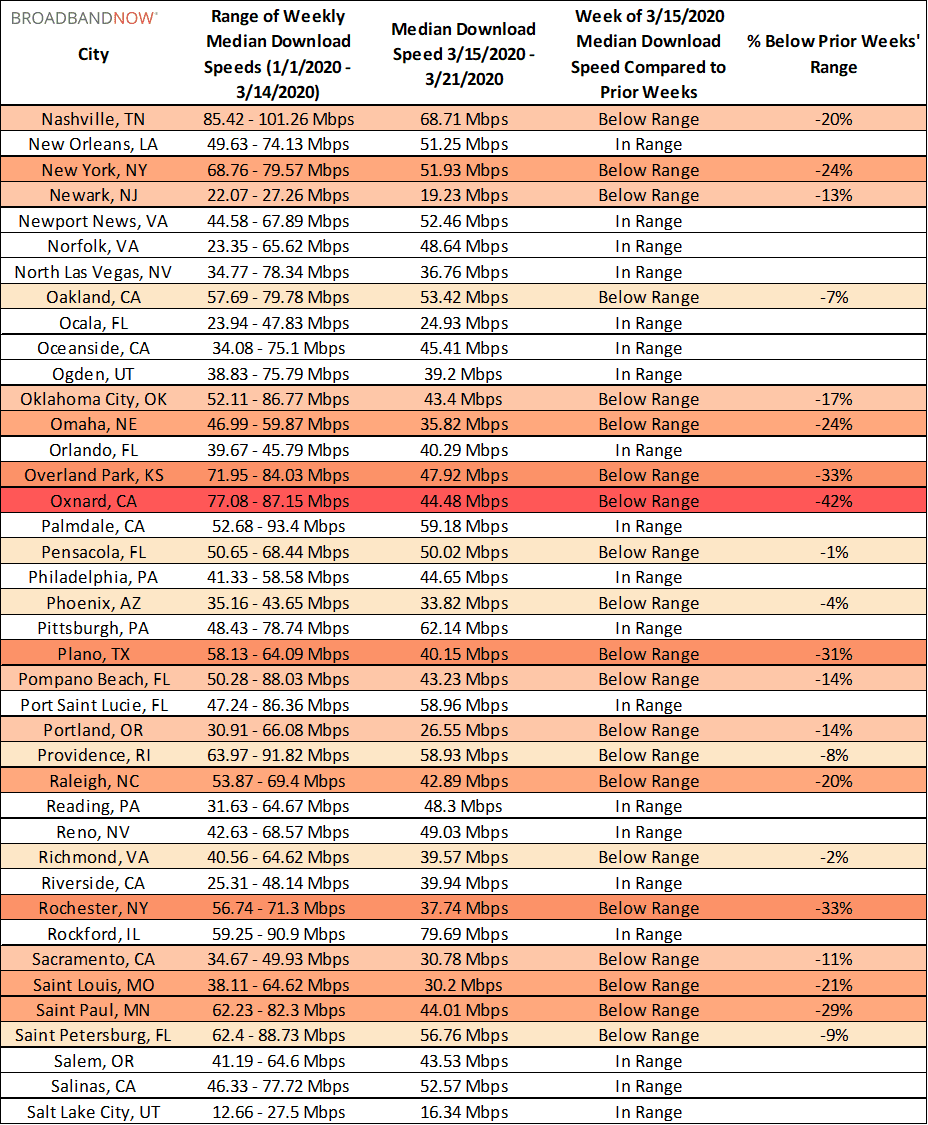
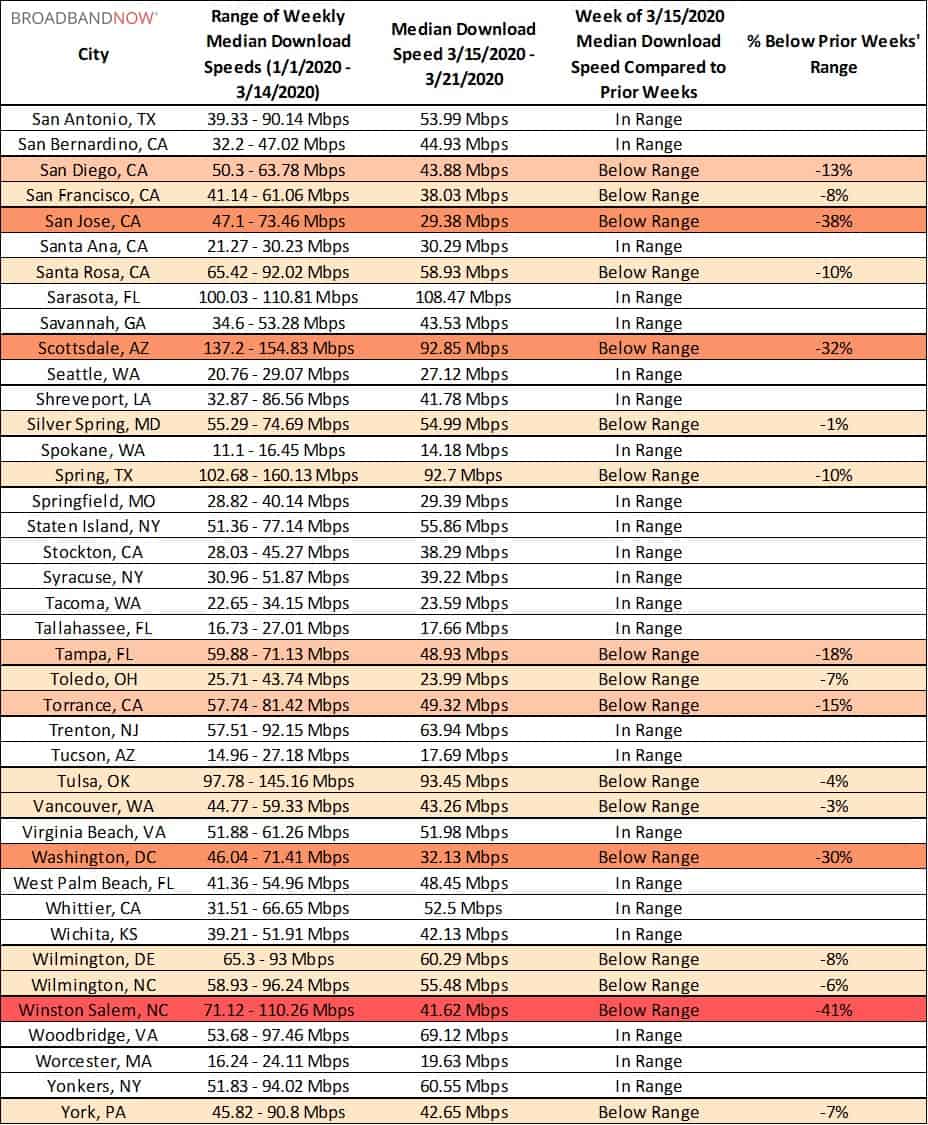
Median Download Speed – 200 Most Populous U.S. Cities
Are you a journalist or researcher writing about this topic?
Contact us and we'll connect you with a broadband market expert on our team who can provide insights and data to support your work.
Download Speed Trends Over Time
Though many cities listed below have experienced some degree of degradation in terms of median download speed, the vast majority of them are still well within speeds that can support crucial remote work and learning tasks.
That said, it is important to note that though speeds may be holding relatively steady across the nation, many areas do not have robust connections to begin with. For instance, though internet providers in Anchorage are holding up, its median download speed of 17.77 Mbps is well below the FCC’s current definition of broadband, which is 25 Mbps. The state itself currently ranks 51st in our list of best and worst states for internet coverage, pricing, and speeds.
Encouragingly, many of the areas hit hardest by the spread of the coronavirus are holding up to increased network demand. Internet service providers in San Francisco, Chicago and Los Angeles, have all experienced little or no disruption.
New York City, now the epicenter of the virus in the U.S., has seen a 24% dip out of its previous ten-week range. However, with a new median speed of nearly 52 Mbps, home connections still appear to be holding up overall.
The tables below show MLabs download speeds comparing the week of March 15th to the previous 10 weeks for the top 200 U.S. cities by population, in alphabetical order.
How Providers Are Responding
In response to the shifting dynamic we are currently experiencing, providers have suspended data caps, increased base-level speeds, and extended free access to low-income internet plans and public hotspot programs in order to ensure as many Americans as possible can remain online during this period.
Many major ISPs have publically reassured users that they are more than able to keep up with the increased demand, and while looks to be largely true across the most populous areas of the U.S., it remains to be seen if rural communities reliant on legacy technologies such as DSL will continue to enjoy the same relative stability we have seen over the past week.
Are you a journalist or researcher writing about this topic?
Contact us and we'll connect you with a broadband market expert on our team who can provide insights and data to support your work.
About the data
We analyzed raw speed test data from MLabs for the top 200 cities by population in the U.S. in order to determine how well ISP’s are coping with this unprecedented surge in demand. Data was taken from the past 11 calendar weeks, and we calculated median download speeds and ranges for every city listed based on this information.