
Rural Americans already live without access to robust connections, and the shift into remote work could make this issue even more apparent in the coming weeks
Large swaths of the American population have transitioned to working and learning from home as the coronavirus pandemic continues to unfold around the world.
We have been tracking internet speeds across many of the largest U.S. cities in an effort to better understand how this unprecedented shift may be impacting our internet infrastructure.
For this week’s report, we have expanded our analysis to include data on how rural America is faring, as well as including both upload and download speeds over time.
Key Findings
- More of America’s most populous cities saw decreases in median download speeds this week compared to the last. 117 cities (59%) have now shown signs of potential network strain, up from 88 cities (44%) in last week’s report.
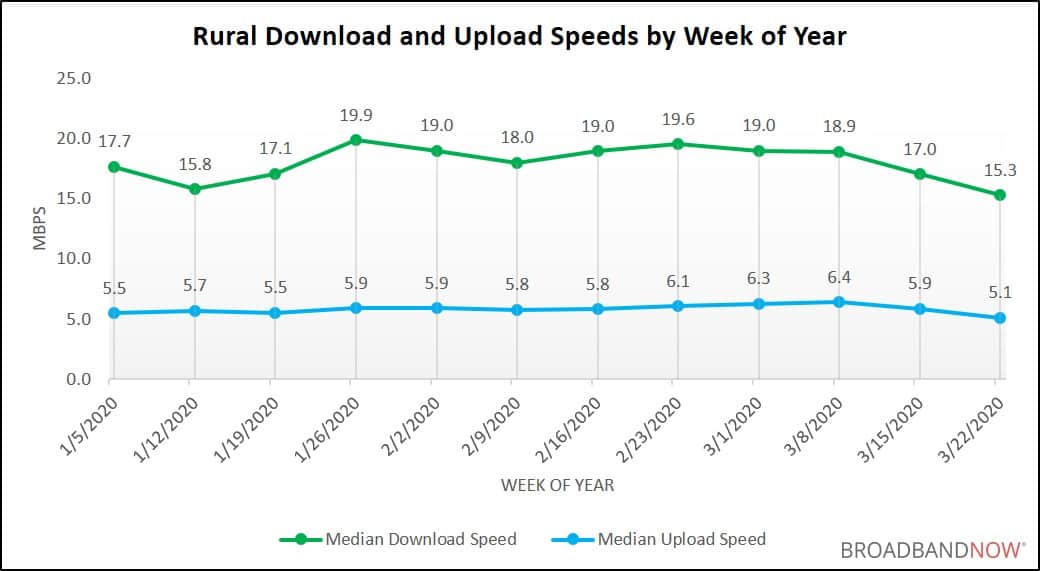
- Rural download speeds around the country are down 3.1% for the week of March 22nd to 28th compared to the weeks of January 5th to March 8th (we excluded the first partial week of 2020). Rural upload speed is down by 6.9% compared to the same period.
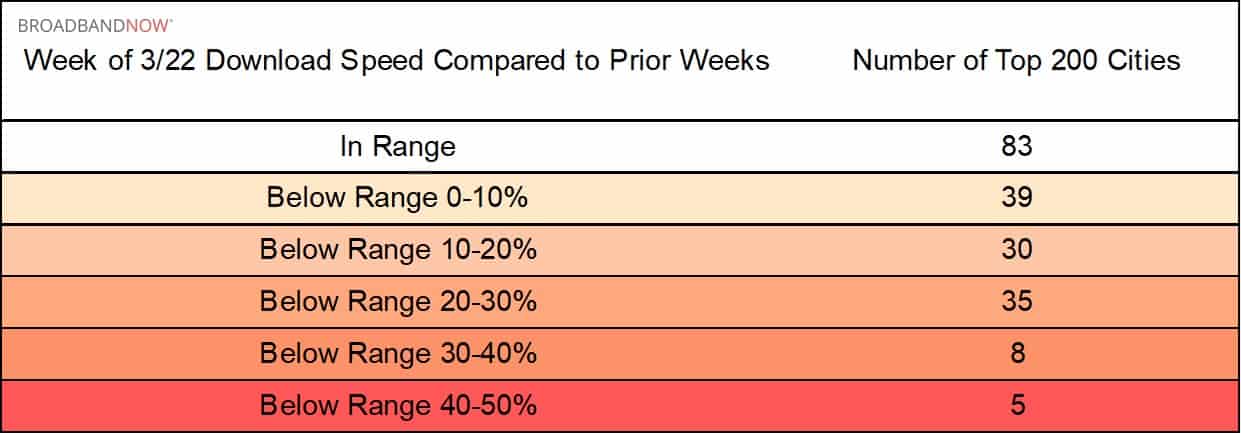
- 117 (59%) of the top 200 cities we are currently tracking have experienced download speed degradations over the past week compared to the first 10 weeks of 2020. Five cities have observed download speed dips greater than 40%.
- 144 (72%) cities have experienced degradation in upload speeds, with three seeing decreases greater than 40% in out of range.
Rural Data
To gain a better understanding of how rural Americans were faring during this unprecedented situation, we aggregated speed test data across all U.S. zip codes in counties marked as non-metropolitan (“Micropolitan” and “Noncore”) under the CDC’s Urban–Rural Classification Scheme. We chose to collate these results in aggregate due to the disparate amount of speed test data available in rural communities.
Median Internet Speeds – 200 Most Populous U.S. Cities
For this week’s report, we have started tracking upload speeds in addition to download speeds. Upload Speeds are important for two-way communication applications such as Skype, Slack, and Zoom, which many Americans are currently relying on to work and learn from home.
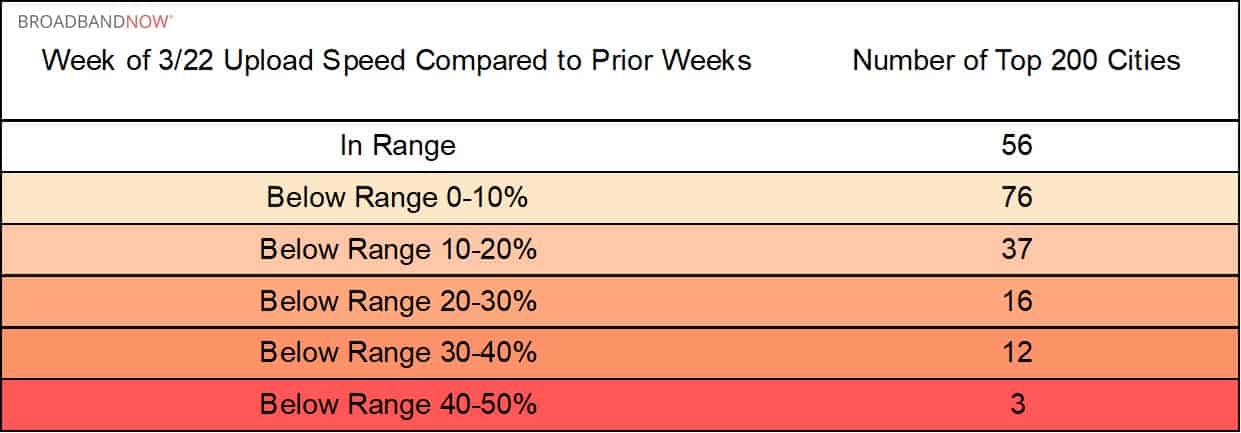
Below, we’ve compared the the range of median upload and download speeds of prior weeks of the year to the week of March 22nd. Most cities are still holding relatively steady, but it is important to note that we have observed an uptick in the overall number of cities experiencing a download speed degradation from last week. The tables below show how many cities fell into each category we measured over the 13-week testing period.
Are you a journalist or researcher writing about this topic?
Contact us and we'll connect you with a broadband market expert on our team who can provide insights and data to support your work.
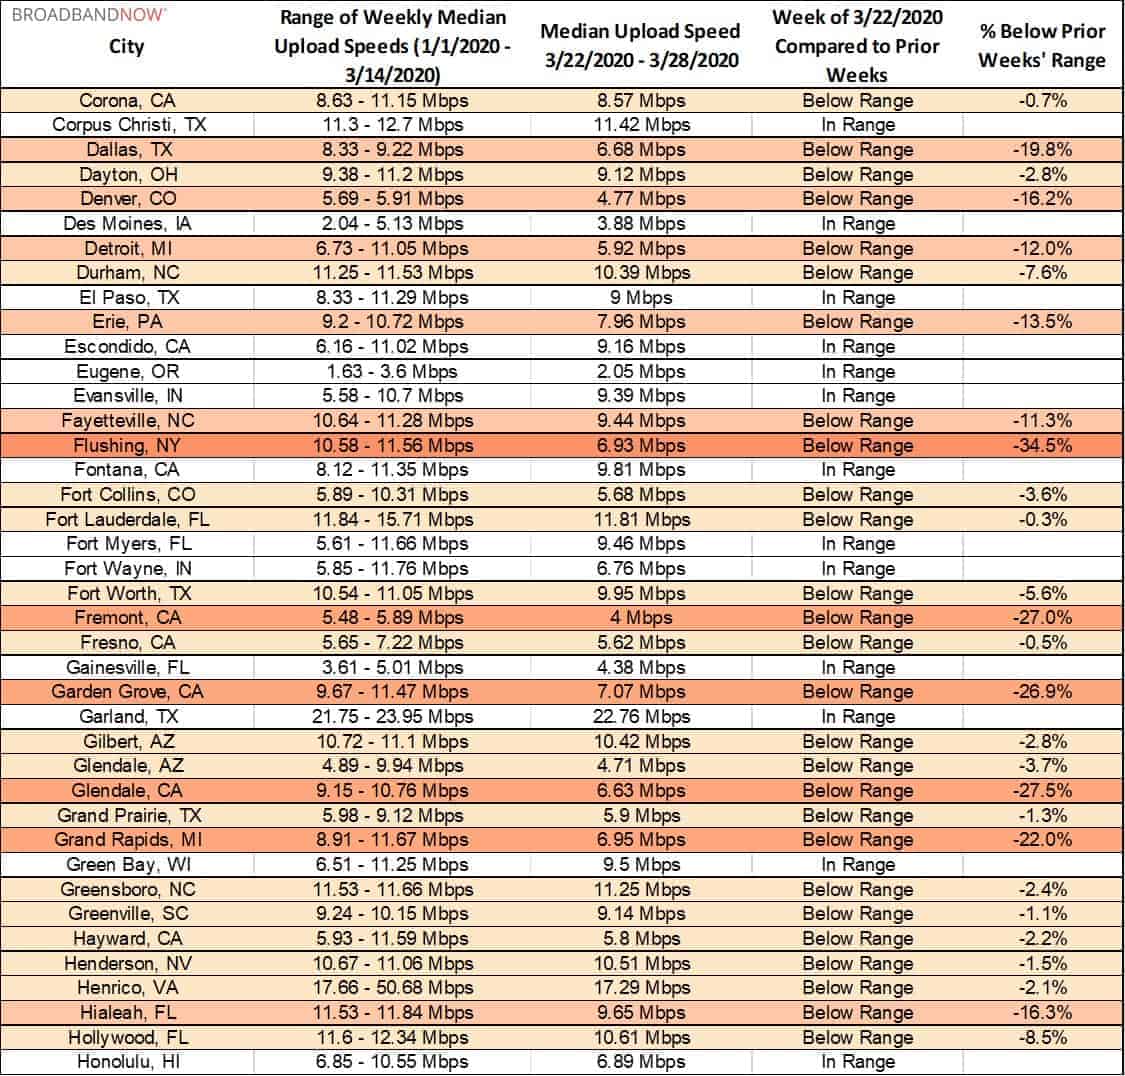
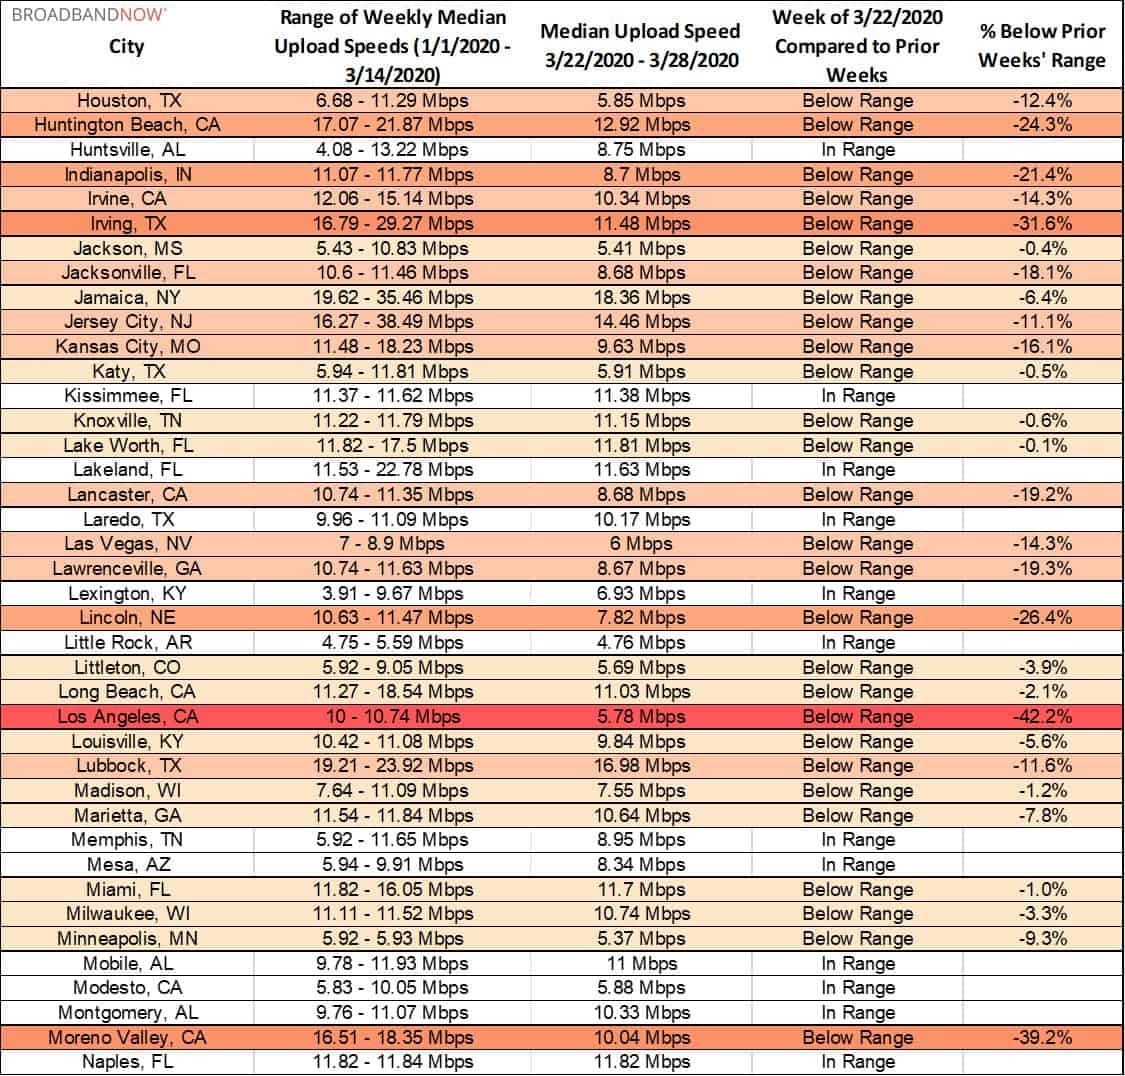
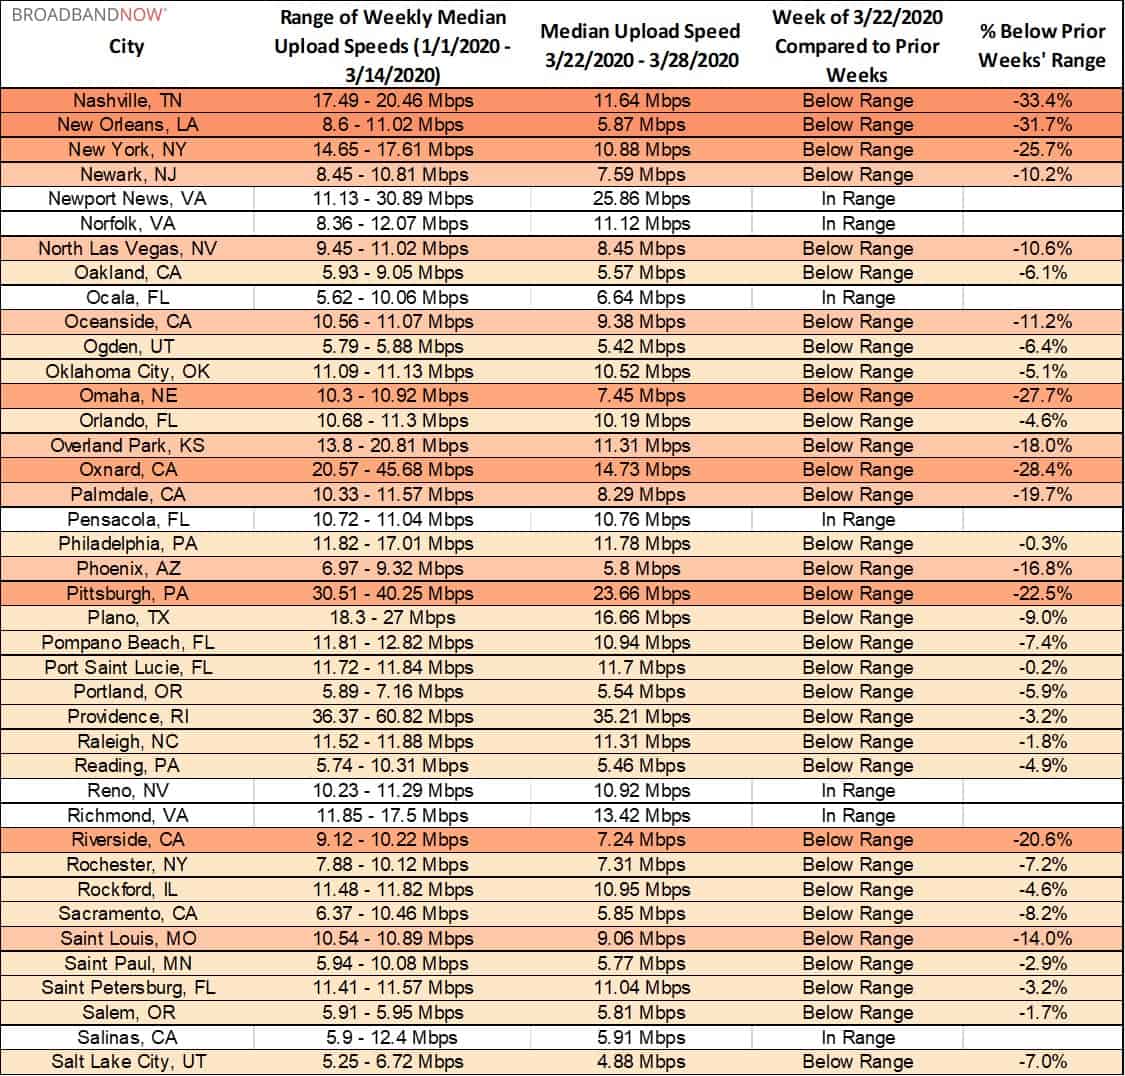
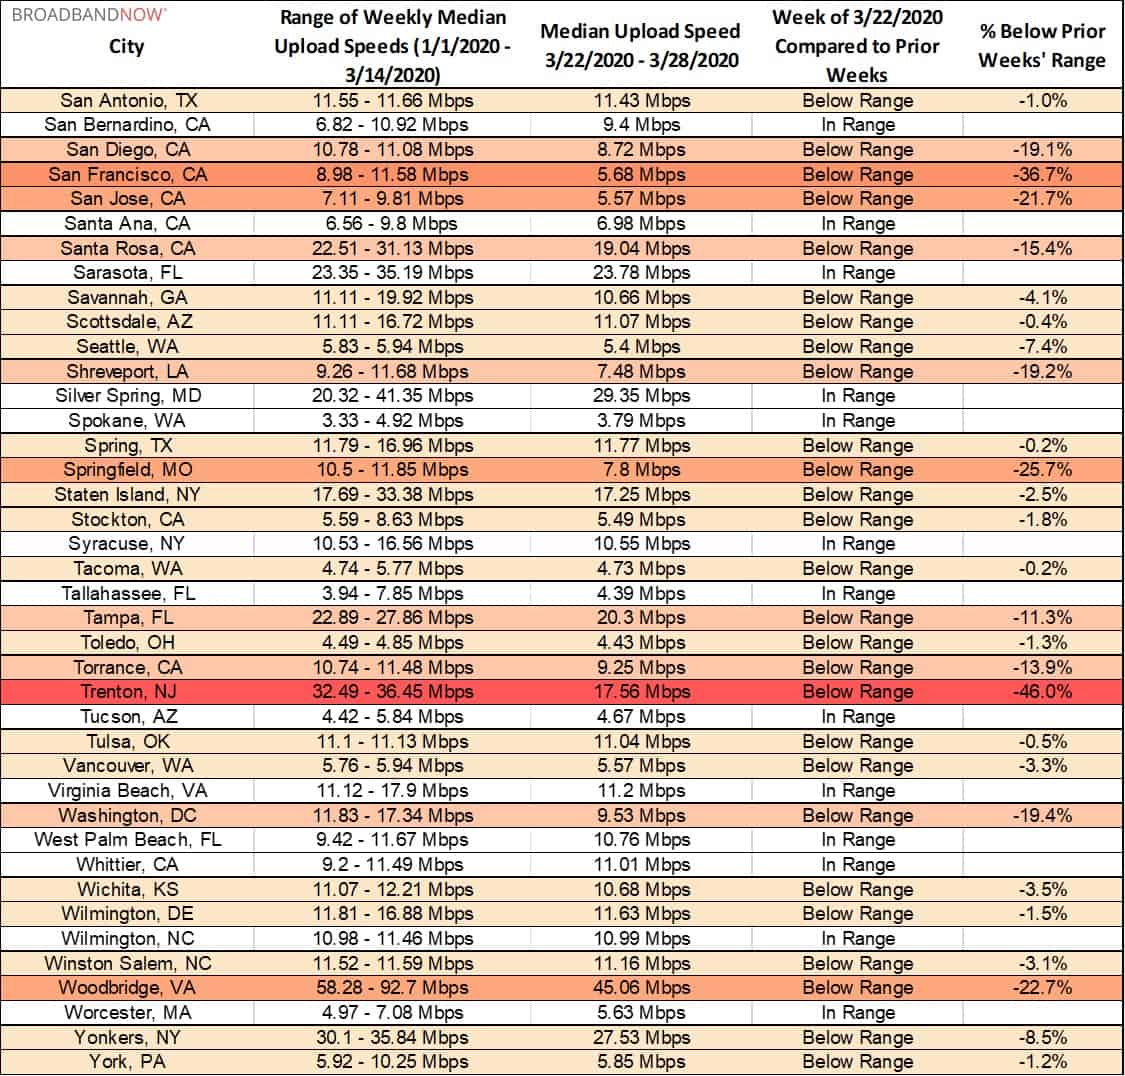
Upload Speeds Over Time
The majority of cities we are currently tracking (132) have experienced little to no upload speed degradation, either staying in range of prior weeks or coming in less than 10% out of range.
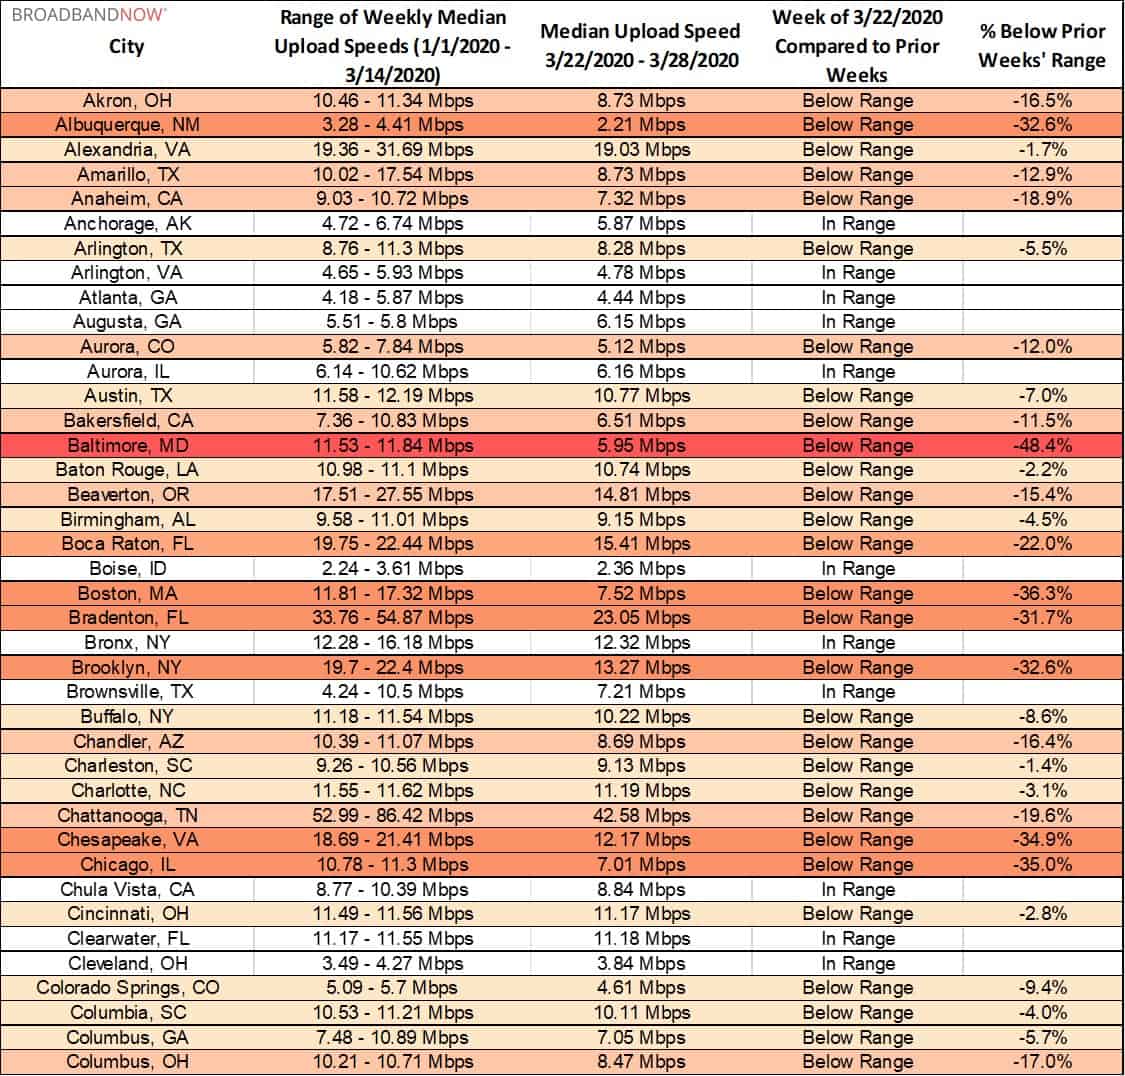
That said, it is interesting to note that several cities have seen more significant dips, such as Brooklyn, Chicago, Nashville, New York, and San Francisco, among others. Three cities have experienced severe drops out of range in upload performance, including Baltimore, Maryland, Los Angeles, California, and Trenton, New Jersey.
The tables below show M-Lab’s upload speeds comparing the week of March 22nd to the weeks of 1/1 to 3/14 for the top 200 U.S. cities by population, in alphabetical order.
Download Speeds Over Time
Several cities that were negatively affected in last week’s report continue to show signs of strain, while more in total have begun to dip out of their previous ranges.
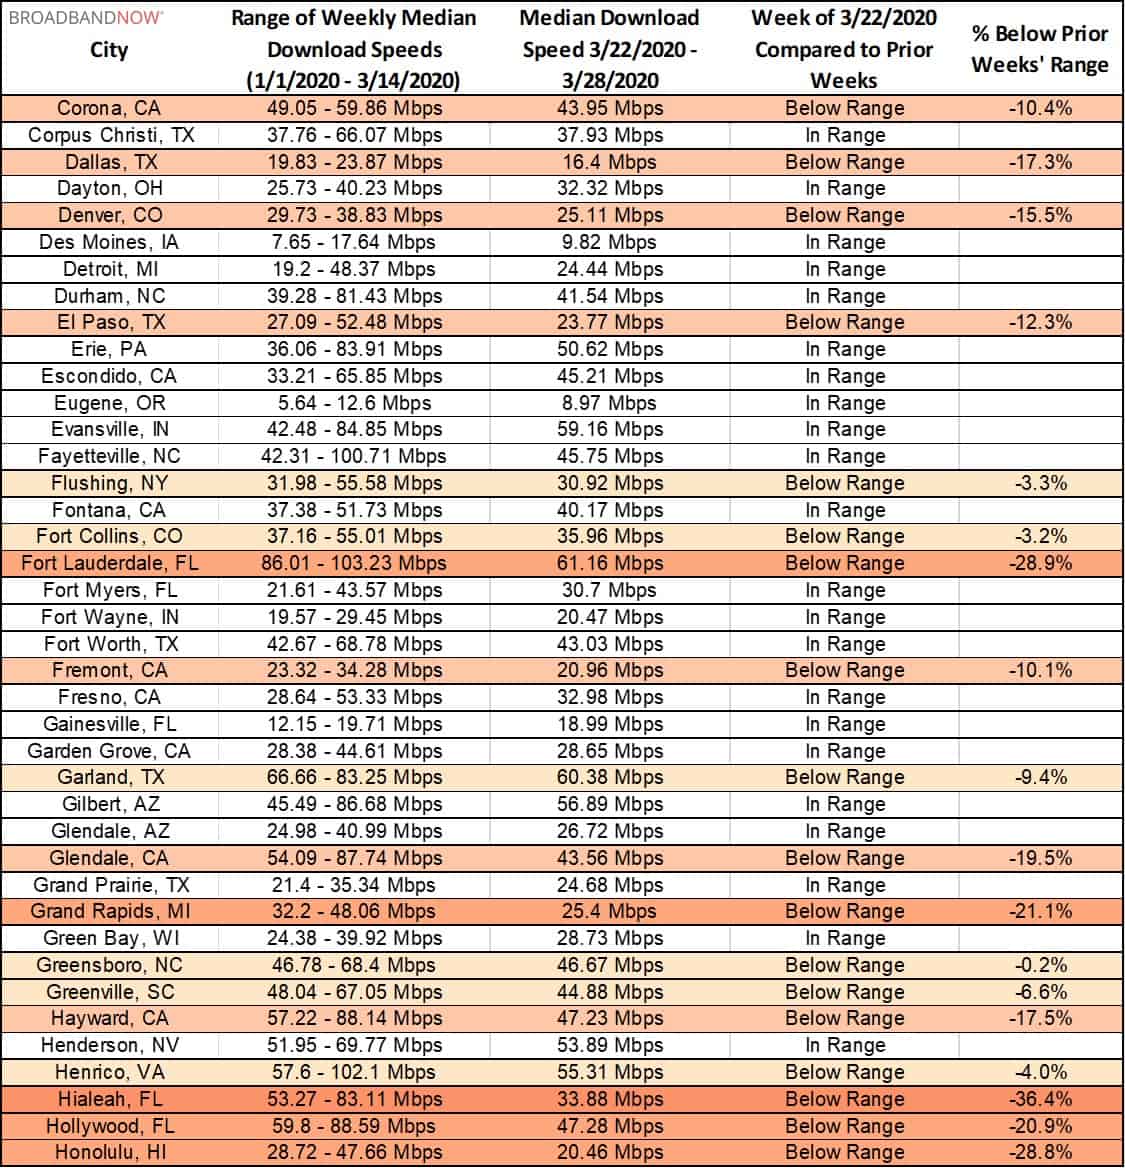
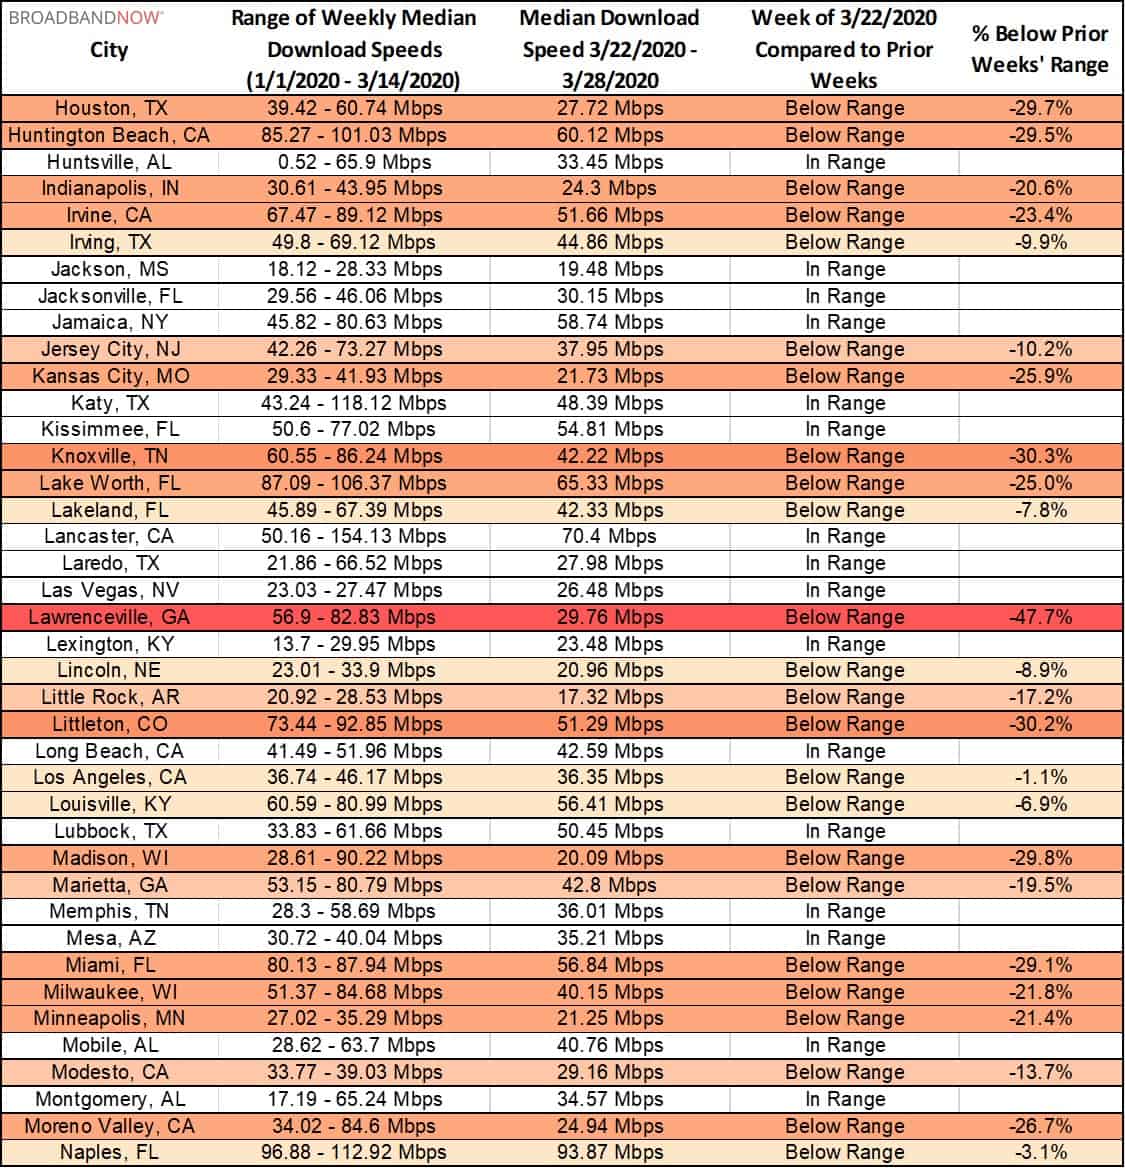
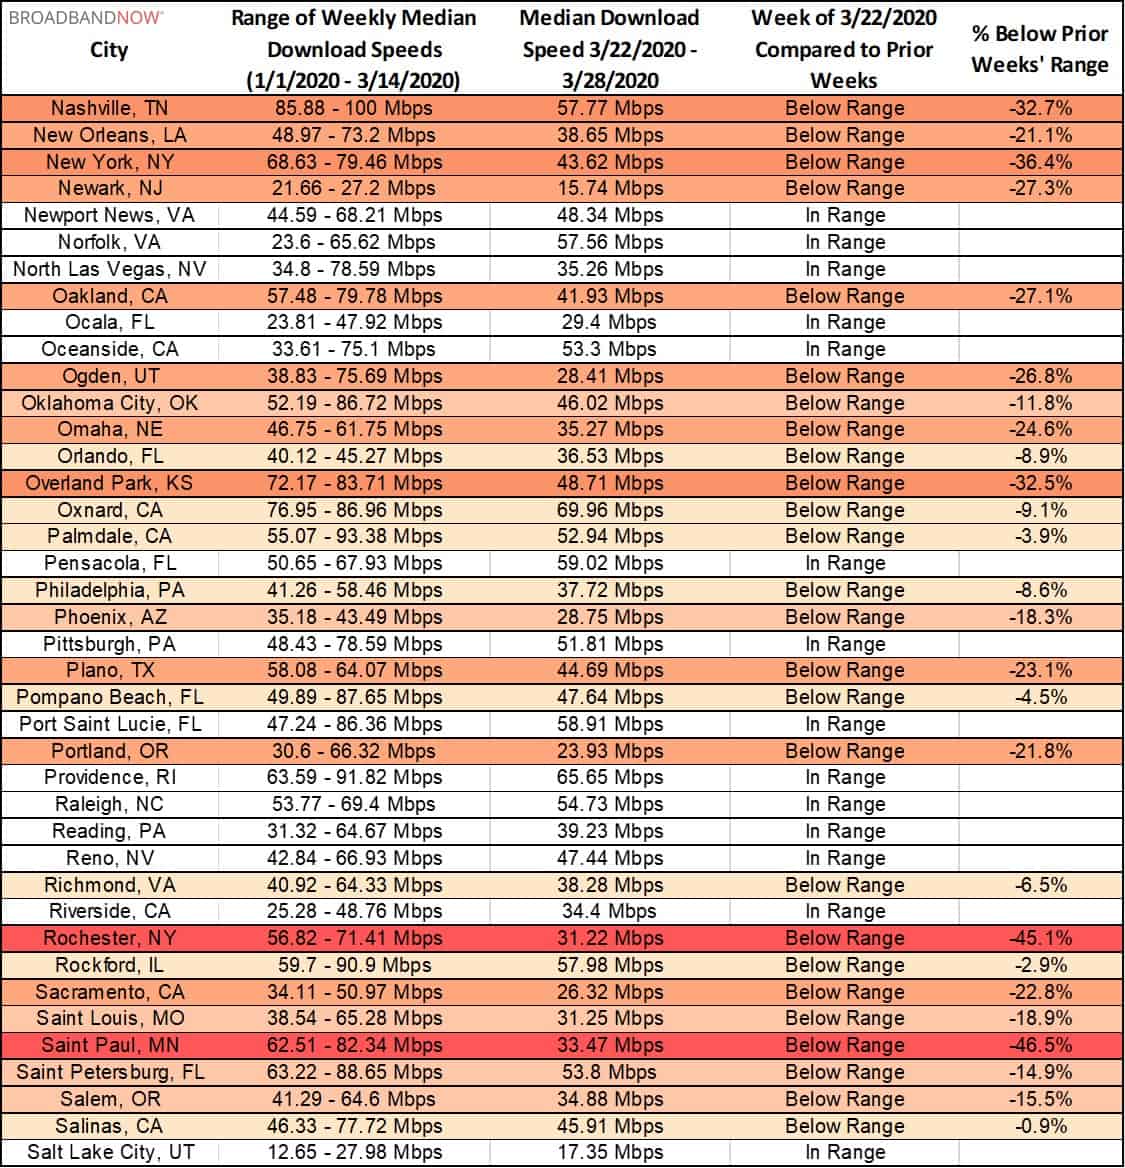
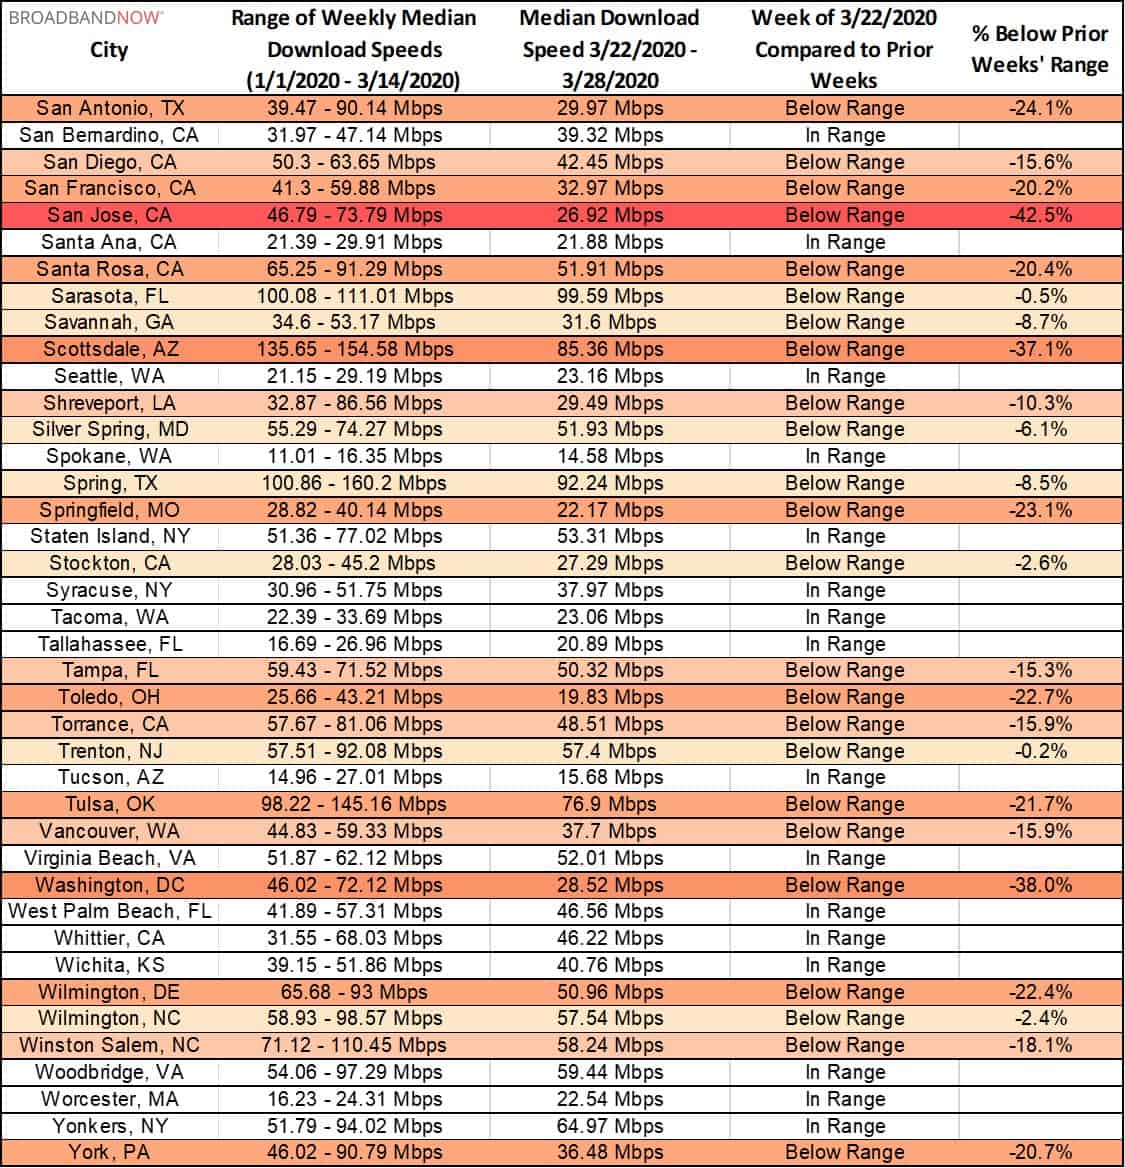
Five cities experienced download speeds falling out of range by 40% or greater, including Austin, Texas, Lawrenceville, Georgia, Rochester, New York, Saint Paul, Minnesota, and San Jose, California. Other cities that fell into this category last week have shown some improvement, including Winston Salem, North Carolina, which has risen to a median download speed of 58 Mbps from 42 Mbps.
The tables below show M-Lab’s download speeds comparing the week of March 22nd to the weeks of 1/1 to 3/14 for the top 200 U.S. cities by population, in alphabetical order.

Prior Reports
This report is the latest in a series of reports looking into the stability of American internet networks amid the coronavirus pandemic. You can read prior weeks’ reports below:
- Home Internet Connections Holding Steady In Most Major US Cities Amid Mass Shift To Remote Work
- Internet Speed Analysis: Top 200 Cities, March 15th – 21st
About The Data
We analyzed raw speed test data from M-Lab for the top 200 cities by population in the U.S. in order to determine how well ISP’s are coping with this unprecedented surge in demand. Data was taken from the past 13 calendar weeks, and we calculated median download speeds and ranges for every city listed based on this information.
We also looked at the rural areas as defined by the CDC’s Urban–Rural Classification Scheme as non-metropolitan areas and measured their speeds, in aggregate, by week. The M-Lab’s data we used includes all users running speed tests on various websites, and does not separate by device type or ISP.