
Fiber-optic cables are the gold standard for broadband infrastructure. The backbone of the World Wide Web utilizes fiber, and without it, the internet as we know it today would not be possible. With their unparalleled data transmission speed and reliability, the technology poised to become even more critical. They will not only cater to escalating data consumption but also enable innovations in artificial intelligence, virtual reality, and smart cities, fundamentally reshaping our interaction with technology and each other.
As such, tracking fiber penetration across the U.S. broadband market provides valuable insights into technological adoption and accessibility. Tracking penetration is difficult, however, because data on adoption of specific technology types is often not publicly available.
This study is our attempt to solve this issue – we created a machine learning algorithm that is capable of inputting raw speed test data at scale and determining which of the tests were run on a fiber connection, due to the unique performance benchmark the technology exhibits. Through our internal testing, we found that the algorithm has an accuracy rating of ~95%.
Abstract
This analysis explores the growth and distribution of fiber access and penetration rates across U.S. states from December 2021 to June 2023. Our data indicates a steady increase in fiber access, with variations in state penetration rates.
Using historic FCC form 477 data, as well as its new National Broadband Fabric, we created four snapshots of fiber availability ranging from December 2021 to June 2023. We then analyzed M-Labs speed test data for a 2-month period around each snapshot (totaling nearly 300 million speed tests) using machine learning to determine whether each speed test was done on a fiber optic connection.
That gave us the proportion of fiber to non-fiber speed tests for every day in the 2-month period, and we chose the median distribution to represent the observed proportion of fiber to non-fiber internet traffic for that period. Finally, by dividing the observed proportion of fiber traffic by the percentage of people accessing fiber internet, we determined the penetration rate of fiber adoption.
Key Findings
- The average fiber access rate across all U.S. states has steadily increased: In December 2021, the average fiber access rate was approximately 45.9% of households, and by June 2023, it had increased to about 55.6% of households.
- Approximately 5.6 million new households have subscribed to fiber since December 2021. Still, fiber adoption rates are not outpacing growth in fiber access, indicating a potential awareness or marketing issue in many states.
- Alaska had the highest fiber penetration rate of all states at 44.2%, followed by New Mexico (41.74%) and Arizona (35.26%).
- Though 78% of New York households have access to fiber, its penetration rate is relatively lower than some other states at just 11.30%. This indicates potential barriers or other factors leading to slower adoption among those with access.
What is Fiber Internet?
Fiber internet transmits data over longer distances faster than other wired connections such as DSL and cable. This is mostly thanks to its specialized cable structure, which is made of glass fibers rather than traditional copper wires. These glass fibers use light instead of electricity to transfer data. However, a fiber network requires a “fiber to the home” (FTTH) infrastructure, which isn’t cheap and the reason why its availability isn’t as common as DSL or cable.
Growth in Fiber Access Population
From December 2021 to June 2023, there has been a consistent rise in the average population with access to a fiber internet connection.
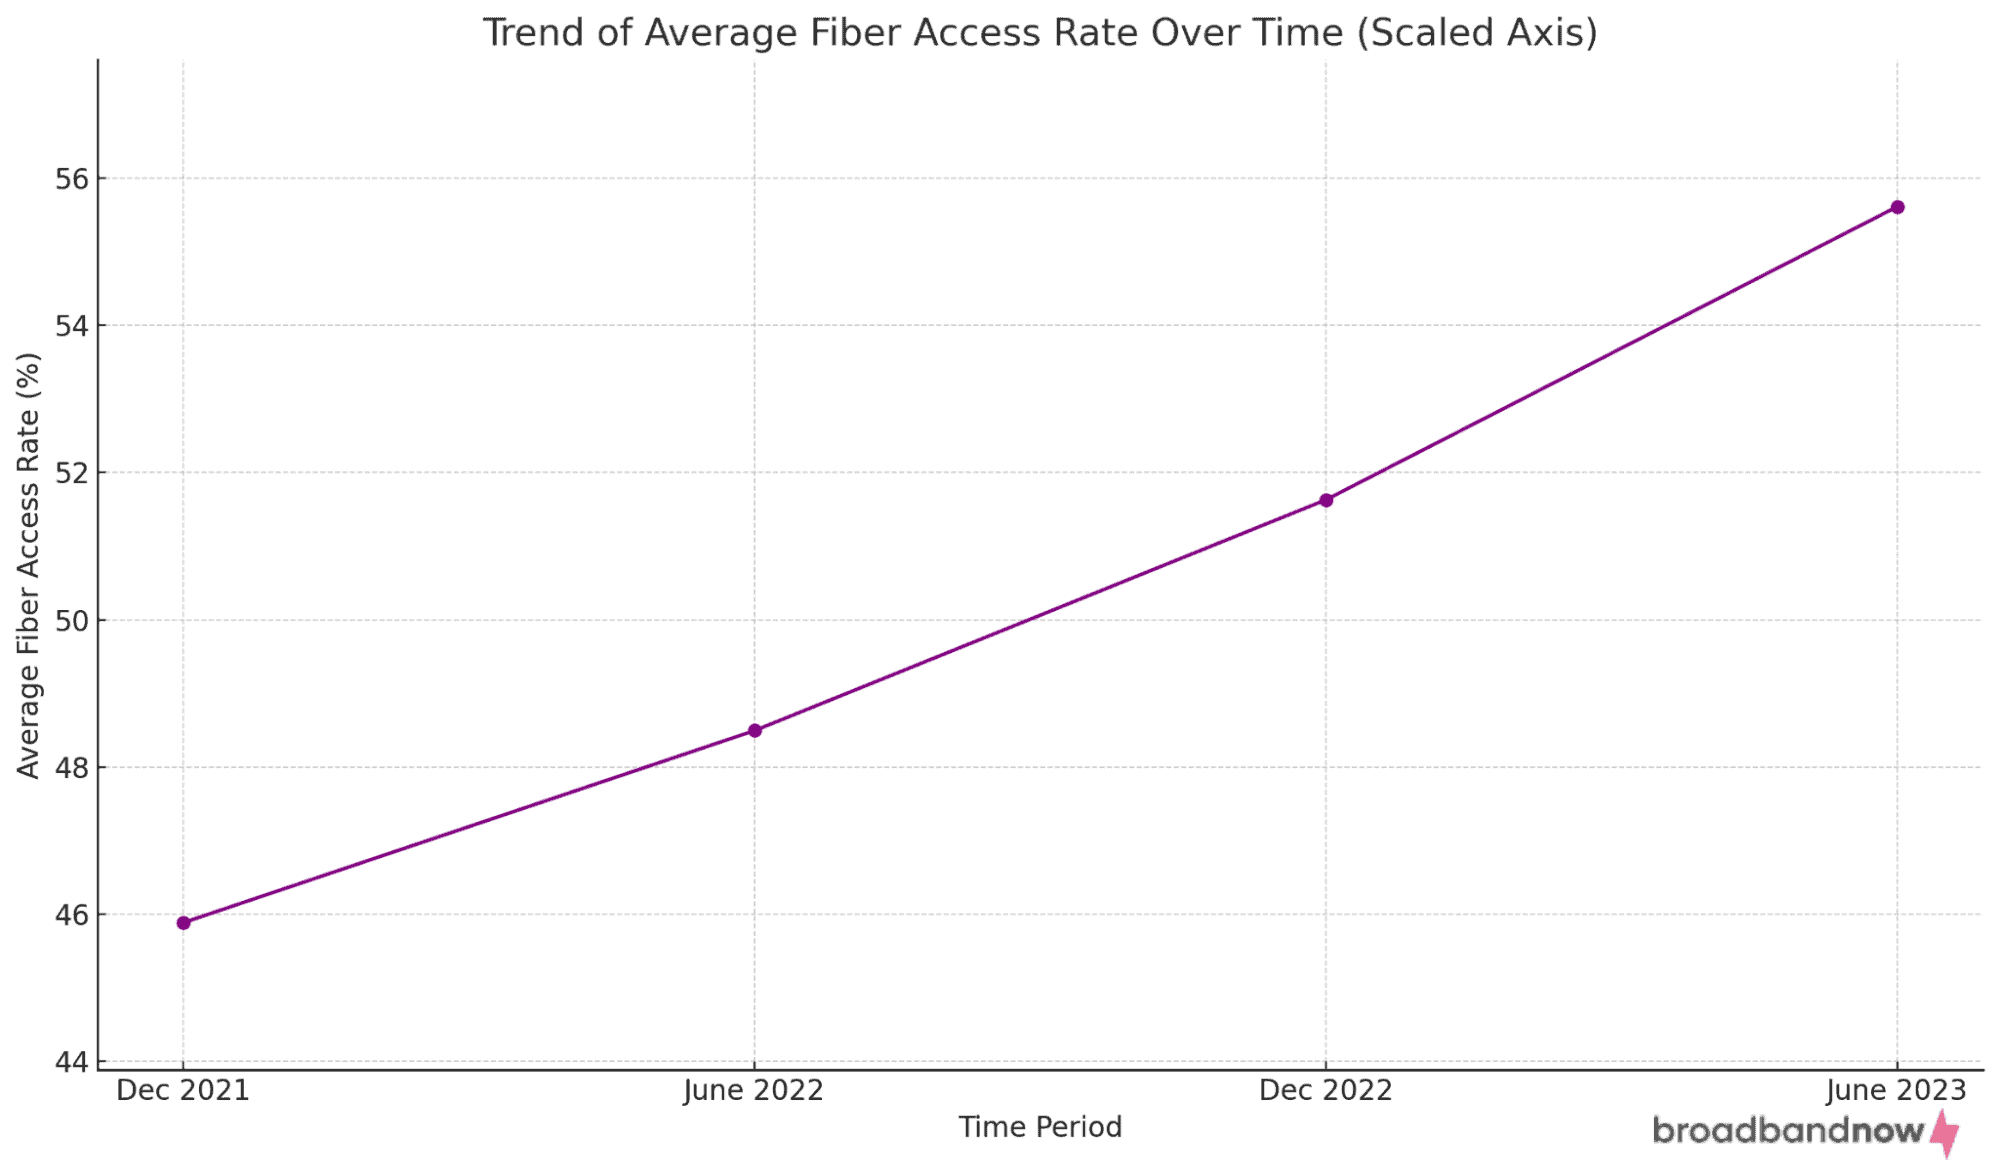
This line chart illustrates the trend in average fiber access rates across the United States from December 2021 to June 2023. Each point on the chart represents the national average fiber access rate at a specific time, showcasing a marked increase over the period. Starting at approximately 45.89% in December 2021, the access rate consistently climbs, reaching around 55.61% by June 2023.
Growth in Average Fiber Penetration Rates

Despite the steady growth in the fiber market, adoption rates have remained relatively flat in areas where the service is available. This could suggest that in these areas, ISPs have achieved market saturation, or it could mean that more efforts are needed to convince users with existing legacy technologies to make the switch.
States with Notable Fiber Penetration
As of June 2023, states with the highest fiber penetration rates included:
- Alaska: 44.17%
- New Mexico: 41.74%
- Arizona: 35.26%
- Nevada: 22.39%
- Colorado: 21.53%
Conversely, the states with the lowest rates were:
- North Dakota: 0.17%
- Vermont: 0.22%
- Montana: 0.36%
- Wyoming: 0.40%
- South Dakota: 0.42%
Distribution of Fiber Penetration Rates

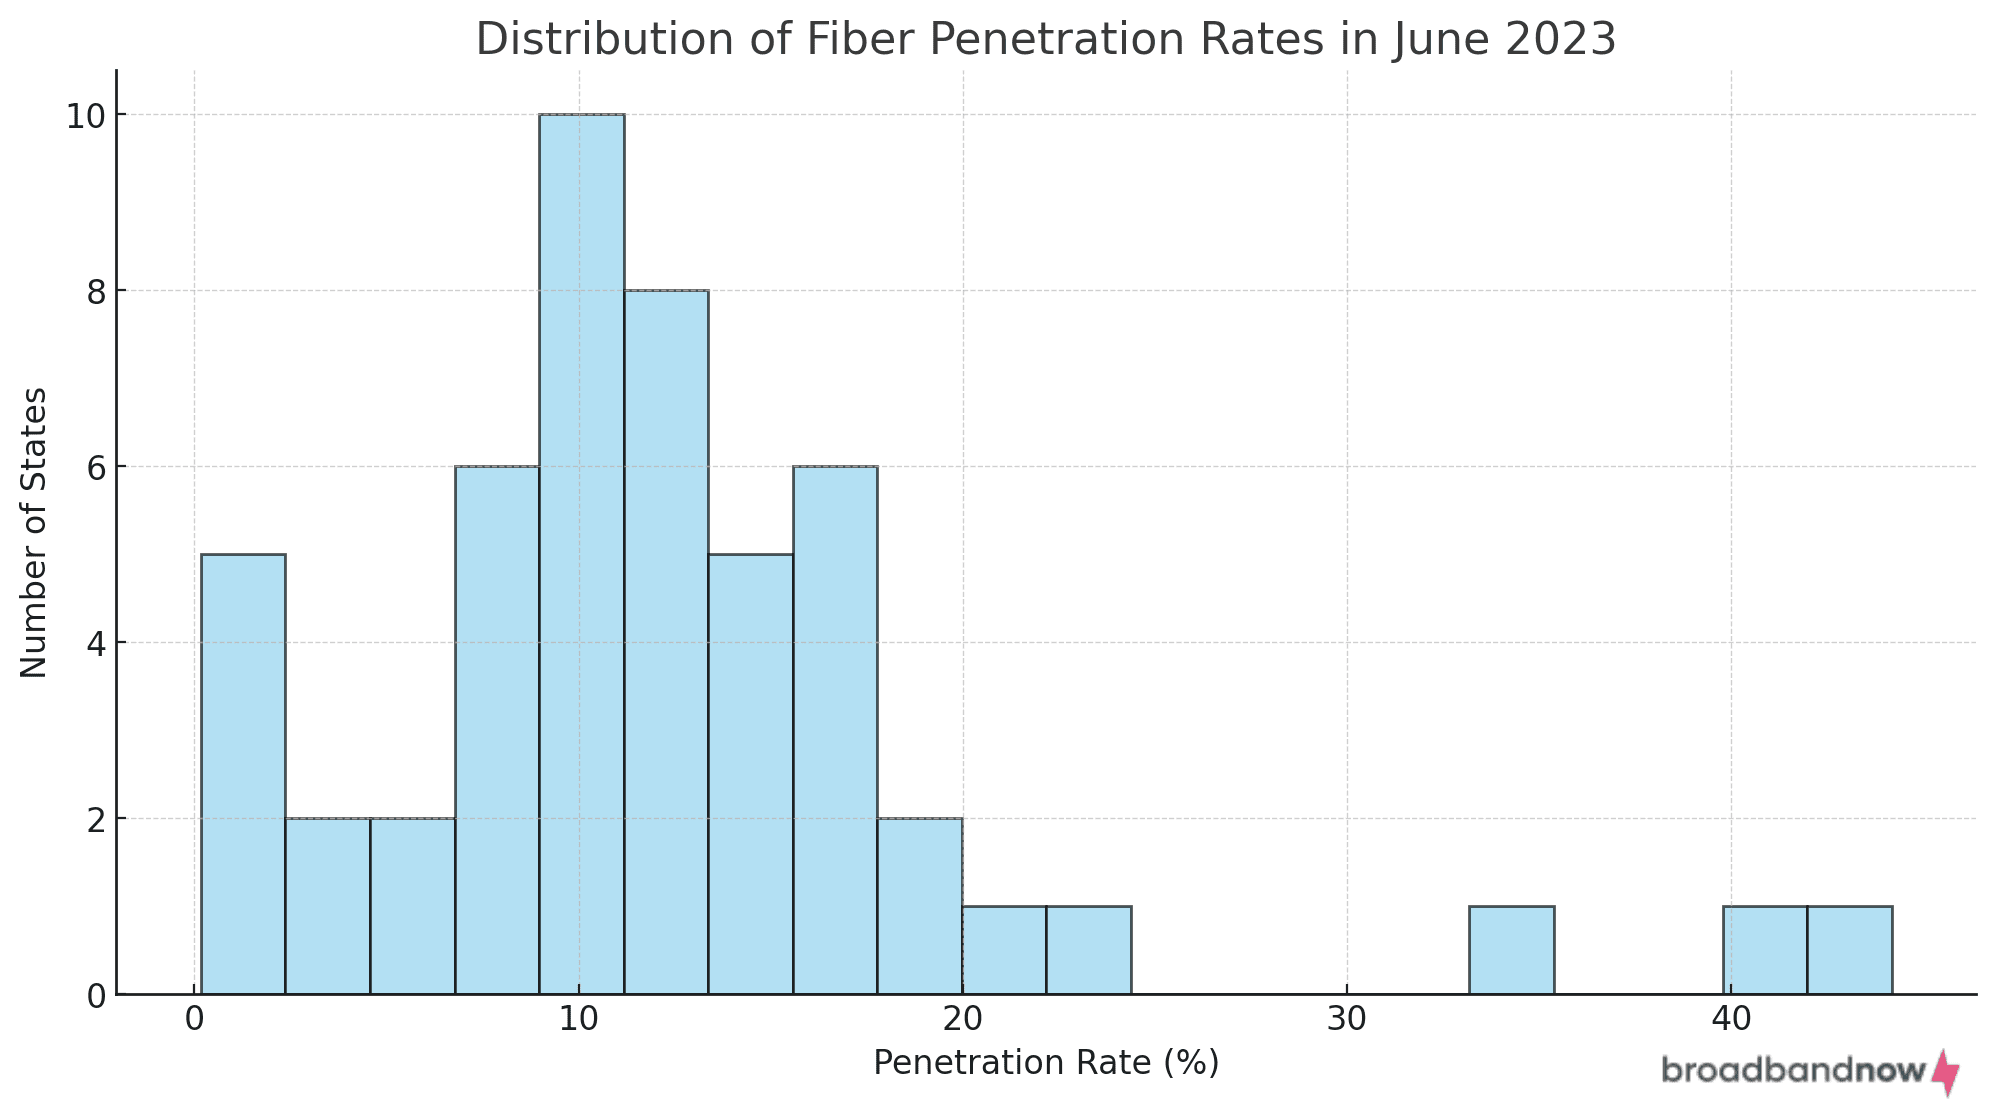
The distribution of fiber penetration rates among states in June 2023 appears bimodal. This suggests that there are two main groups of states when it comes to fiber penetration rates:
- Majority between 10% and 20%: A significant number of states have fiber penetration rates between 10% and 20%.
- Few states with very high or very low rates: There are a few states with very high penetration rates (around 40%) and some states with extremely low rates (less than 1%).
Comparative Analysis of Fiber Access and Penetration – Urban versus Rural
Urban States Average (10 Most Densely Populated)
Time period |
Average percent of households with fiber internet access |
Average percent of those households that are subscribed |
|---|---|---|
| December 2021 | 59.9% | 11.9% |
| June 2022 | 61.9% | 11.3% |
| December 2022 | 64.4% | 11.2% |
| June 2023 | 67.2% | 13.5% |
Rural States Average (10 Least Densely Populated)
Time period |
Average percent of households with fiber internet access |
Average percent of those households that are subscribed |
|---|---|---|
| December 2021 | 35.9% | 13.1% |
| June 2022 | 36.4% | 12.4% |
| December 2022 | 39.4% | 14.1% |
| June 2023 | 42.1% | 13.4% |
Clear Access Disparity
Urban states, on average, have significantly higher fiber access rates compared to rural states. This highlights the infrastructure challenges in more sparsely populated areas.
Surprising Penetration Observations
Interestingly, rural states have slightly higher penetration rates for some periods compared to urban states. This suggests that where fiber access is available in rural areas, there’s a good chance people are subscribing to it, possibly due to limited alternatives.
Growth Over Time
Urban and rural states have shown growth in fiber access over the period. However, urban states have a more pronounced increase in access rates than rural states.
This analysis provides a nuanced view of the digital divide in the U.S., shedding light on both the infrastructure challenges and the adoption patterns in different regions.
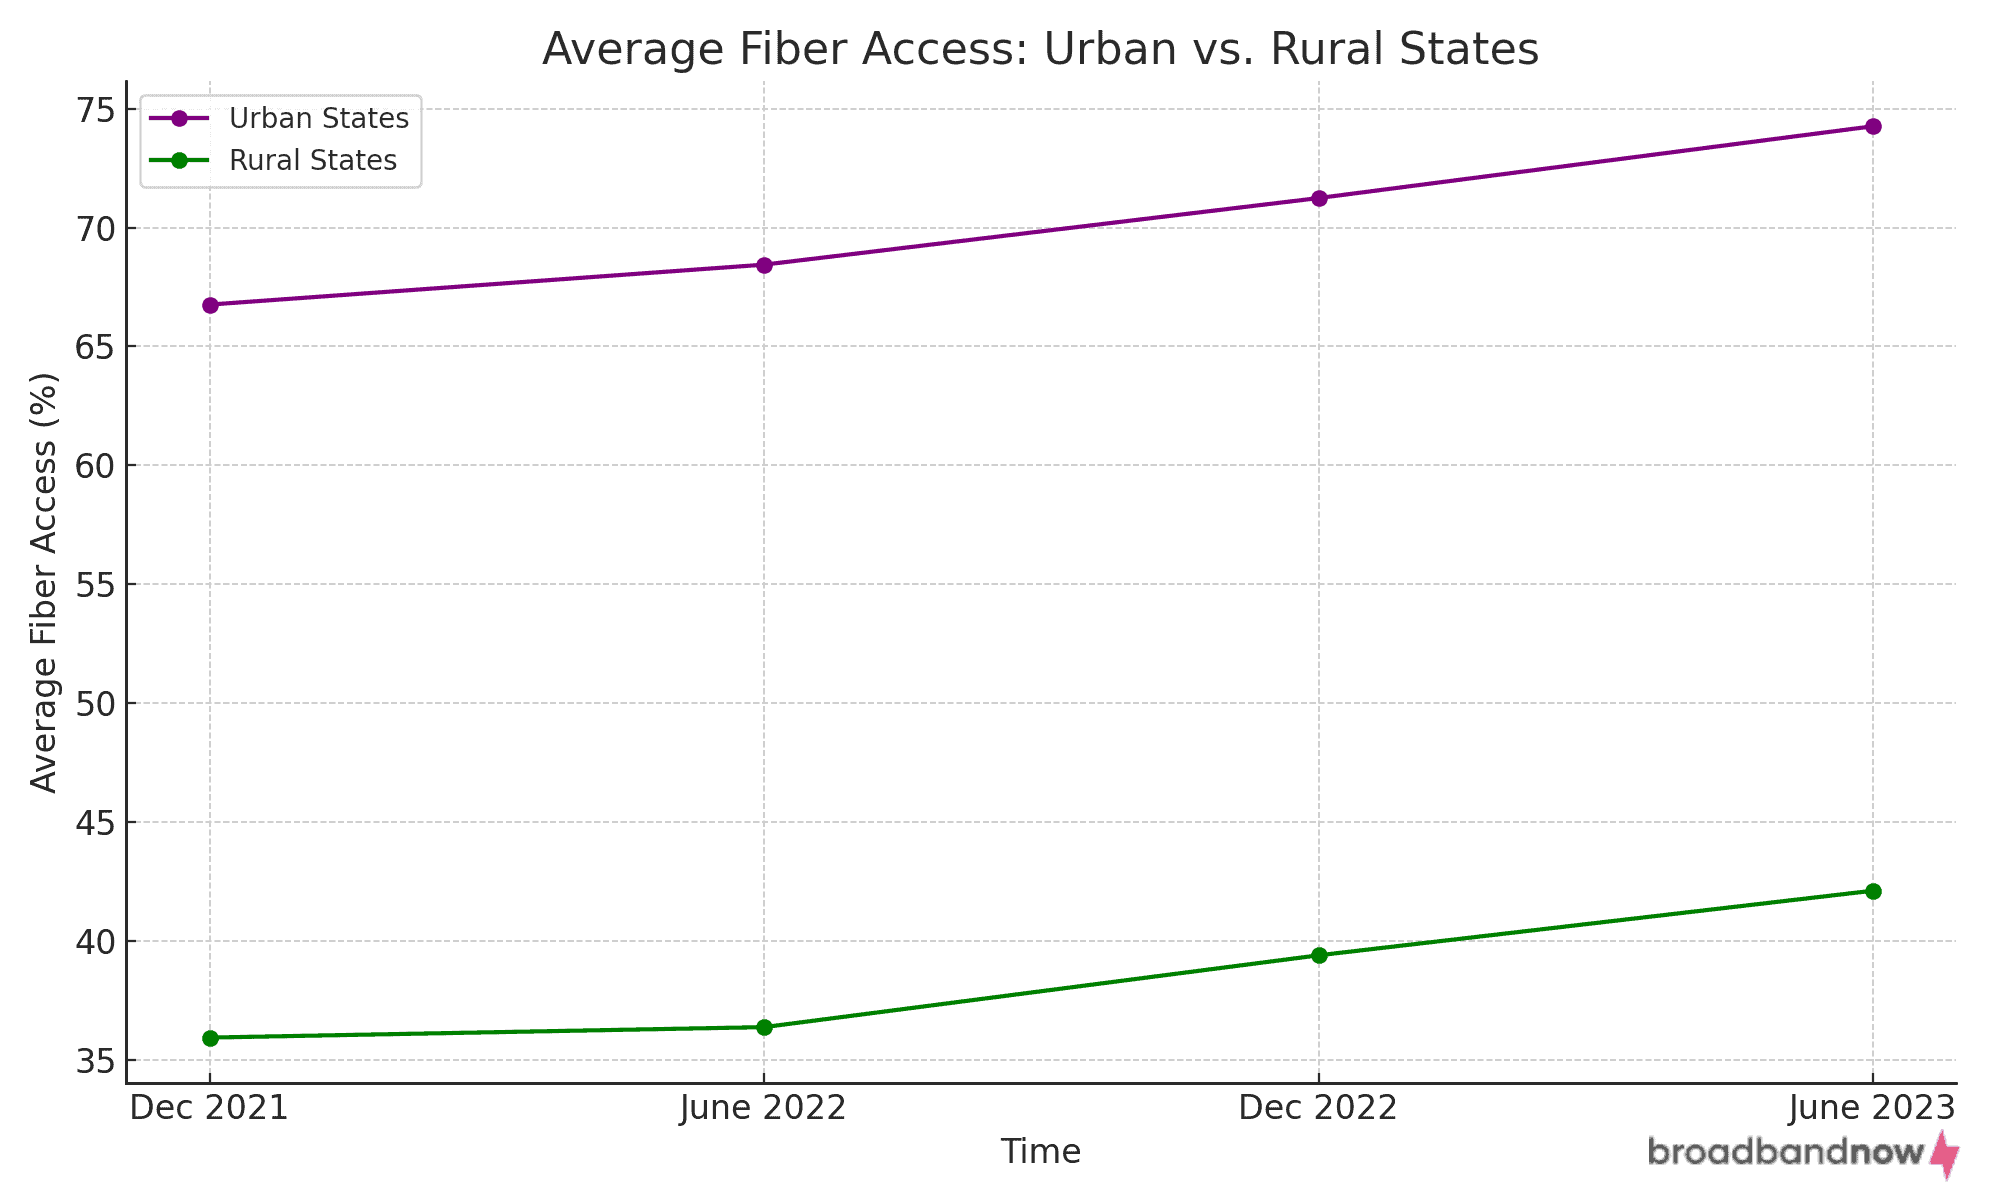
Growth in Fiber Access Rates – Urban vs Rural
The visualizations depict the growth in fiber access over time for urban versus rural states:
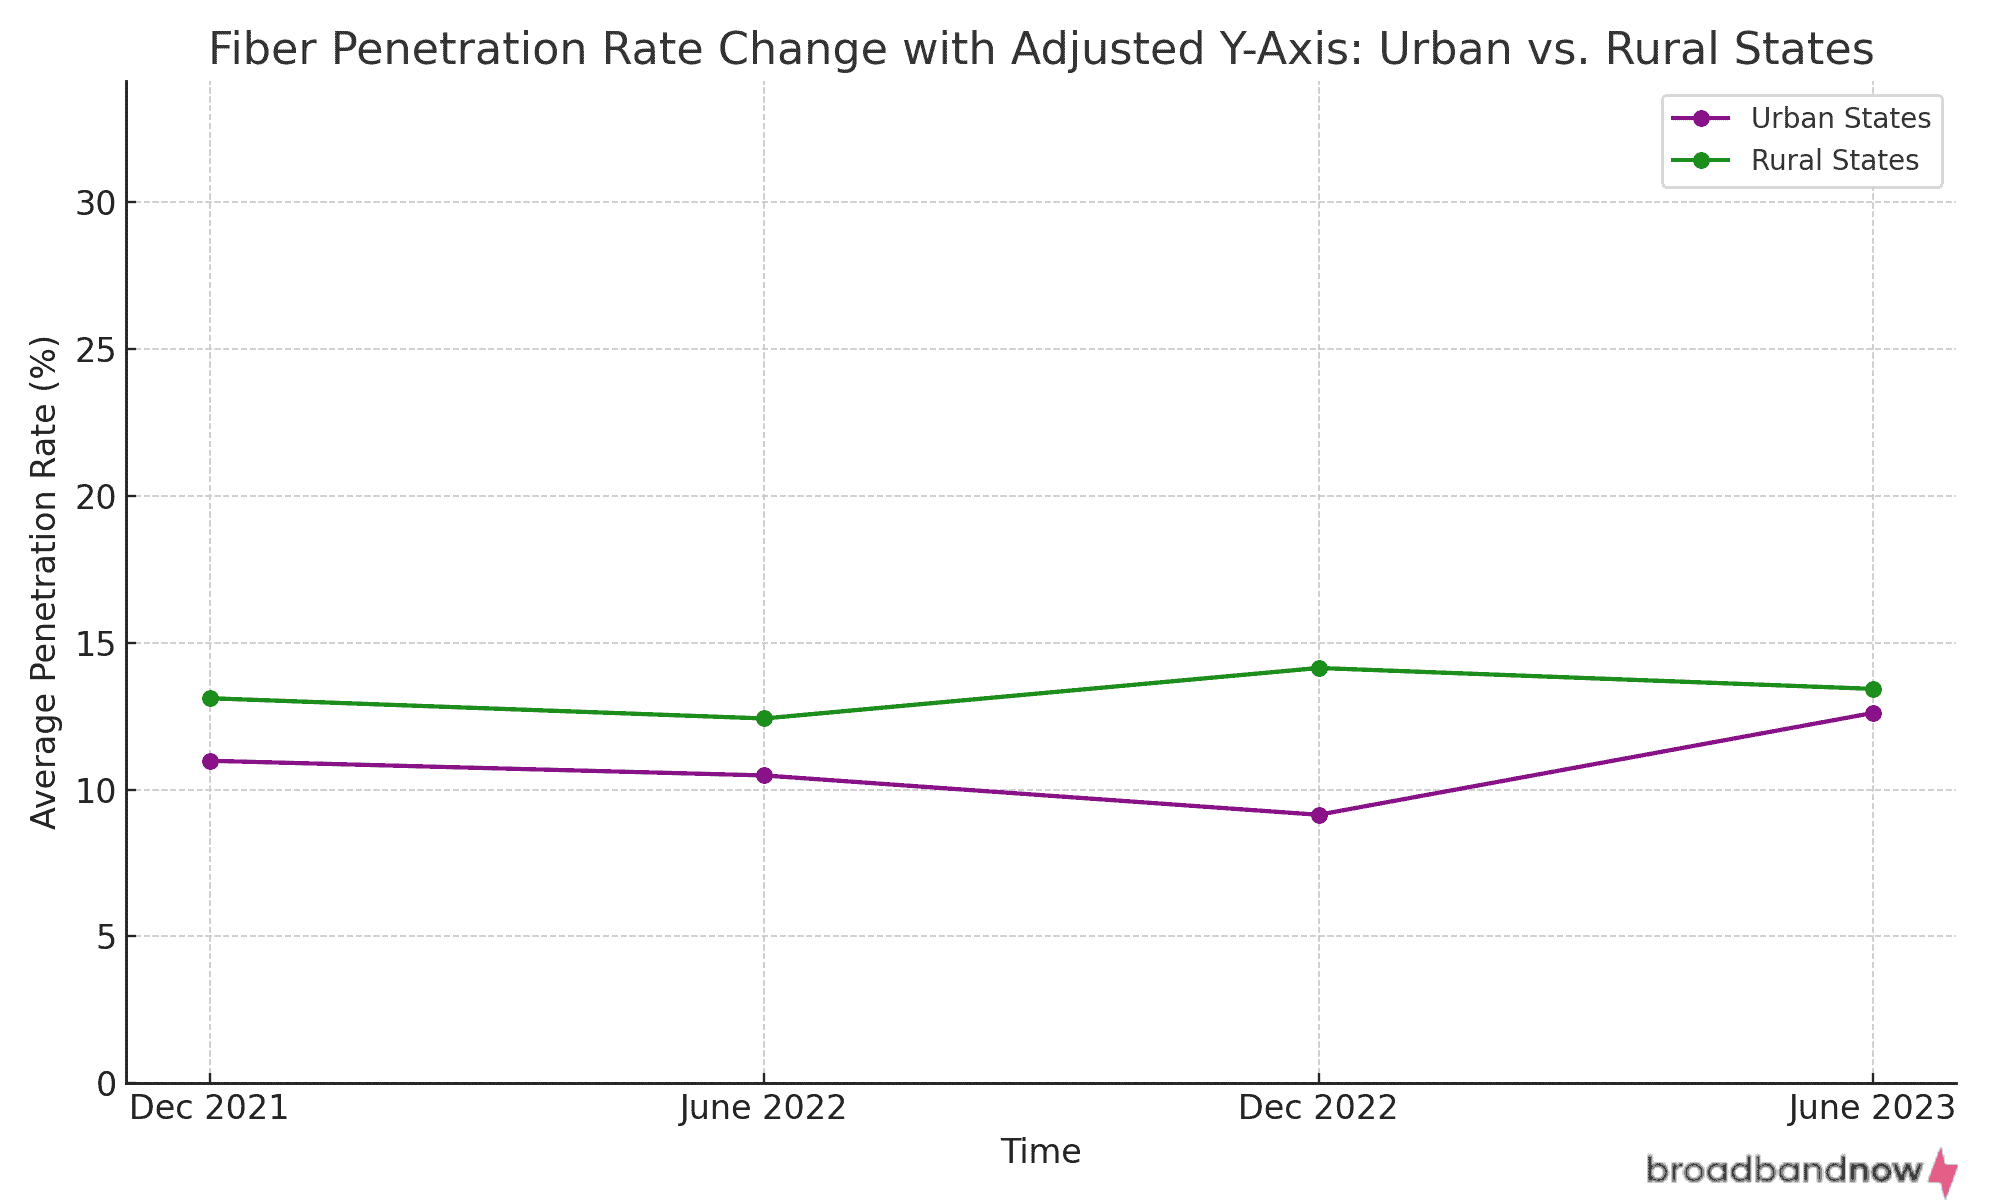
Growth in Fiber Penetration – Urban vs Rural
The visualizations depict the growth in fiber penetration over time for urban versus rural states:
The line chart reflects the average fiber internet access among a selected group of states categorized as urban and rural based on population density. Urban states represented include New Jersey, Rhode Island, Massachusetts, Connecticut, and Maryland, which are among the most densely populated in the United States. The rural states in the chart are Kansas, Nevada, Nebraska, Idaho, New Mexico, North Dakota, South Dakota, Montana, Wyoming, and Alaska, known for their lower population densities.
The chart captures the percentage of each group’s population with access to fiber internet from December 2021 to June 2023. It shows that urban states have a higher percentage of fiber access across all time points, consistent with the expectation that urban areas are more likely to have advanced telecommunications infrastructure.
Conversely, rural states exhibit lower fiber access, reflecting the challenges of extending sophisticated infrastructure into less populated and often more remote areas. The data provides a clear visualization of the digital divide in terms of infrastructure availability between densely and sparsely populated areas.
Discussion
While urban states consistently have higher access to fiber, the penetration growth rate (adoption among those with access) in rural states is commendable and slightly faster in the latter half of the dataset.
The convergence of penetration rates between urban and rural states towards the end of the dataset underscores the importance of accessibility. Once access is provided, rural populations seem as eager to adopt fiber connectivity as their urban counterparts.
The steady growth in fiber access underscores the increasing adoption and expansion of fiber-optic technology across states. However, the disparity in penetration rates suggests varying levels of infrastructure development, policy implementation, and prioritization among states. States with higher penetration might have benefitted from early investments, favorable policies, or a higher demand for advanced communication infrastructure.
Understanding Fiber Access vs. Fiber Penetration
Fiber Access refers to the availability or presence of fiber-optic technology within a specific area or population. It denotes how many people or households can potentially utilize fiber-optic services because the necessary infrastructure is in place. In our dataset, fiber access is represented both in terms of the actual number of people and as a percentage of the total population.
On the other hand, Fiber Penetration quantifies the adoption rate of fiber-optic services. It indicates the proportion of the population that actively uses or subscribes to fiber-optic services out of those with access. A high fiber penetration rate in an area with ample fiber access suggests that much of the population is leveraging the available fiber-optic services.
In essence, while fiber access highlights potential service coverage, fiber penetration sheds light on actual usage.
Conclusion
While fiber-optic technology’s adoption is on the rise, there remains a distinct variation in its penetration across states. Continuous monitoring and analysis are essential to ensure equitable access and to identify areas requiring focused development efforts, especially as we enter the BEAD era.