Introduction
The average U.S. adult spends more than six hours per day consuming digital media, and nearly another six consuming traditional media. This data doesn’t include the 2.2 trillion minutes of talk time and 1.8 trillion texts Americans make each year. In other words, our internet, TV and phone purchase decisions are among our most important and highly considered.
The purpose of this study is to examine U.S. shoppers of internet, TV and phone services, which we collectively refer to as “home services.” Our initial finding, based on a survey of nearly 10,000 U.S. adults, is that nearly 16 percent of adults added or switched home services in 2018 – which totals a whopping 39 million U.S. adults.
Based on additional survey data and anonymized shopping behavior from BroadbandNow, this study looks closely at these 39 million purchase decisions to address why consumers are adding or switching providers at this rate, and if consumers are actually more satisfied after their purchase. We also look at shoppers’ motivation and satisfaction by technology and category. Finally, we compare purchases across age to understand how the shopping behaviors of our youngest adults differ from other cohorts.
Our Data
Data for the BroadbandNow 2019 U.S. Internet, TV & Phone Shopping Study comes from three sources. First, we used anonymized shopping data from BroadbandNow.com, an online resource and consumer guide that millions of Americans use to shop for home services. Second, we asked 9,337 U.S. adults if they had signed up for internet service, TV service (traditional or streaming), or phone service (landline or wireless) in 2018. Those who answered affirmatively were asked a series of questions to understand why they had purchased and to learn more about their experience. Third, we used anonymized provider sales data from 2018.
Highlights
- An estimated 39 million U.S. adults added or switched internet, TV and/or phone service in 2018.
- Nearly 40 percent of consumers indicated price was the primary reason for adding or switching service, more than any other reason, including moving or access to features.
- Consumers who switched TV or internet service in 2018 had higher satisfaction than consumers of that service who did not switch in 2018, except for purchasers of satellite internet service, who were less satisfied. Purchasers of new phone service were also less satisfied than consumers who did not switch.
- More consumers added or switched TV service than phone or internet, with streaming TV as the most popular.
- Fiber internet is driving high consumer interest, both in terms of market share and customer satisfaction. The percentage of customers who purchased fiber internet last year is very high relative to its availability. Fiber customers are also significantly more satisfied than other internet customers.
- Shoppers who bundled two or more services from a single provider were more satisfied than those who didn’t. Satisfaction increased with the size of the bundle, with “Triple Play” customers being the most satisfied.
Which Products Did Consumers Purchase?
Of the 39 million U.S. adults who purchased home services last year, TV service was the largest category as nearly 50 percent of purchasers switched or added new service last year. Streaming TV services contributed to the majority of these purchases, which is unsurprising given the recent growth in cord-cutting. Despite this, cable TV and satellite TV accounted for at least 37 percent of purchases and an additional 37 percent indicated that they subscribed to cable or satellite TV in addition to streaming services.
The next most purchased service was internet, with almost 45 percent of shoppers switching or adding internet service in 2018. Given that 84 percent of U.S. households already had internet service in 2018 , and it is unusual to have more than one internet service provider, we can infer that most of the internet purchases made last year were made by switchers.
Bundling Up
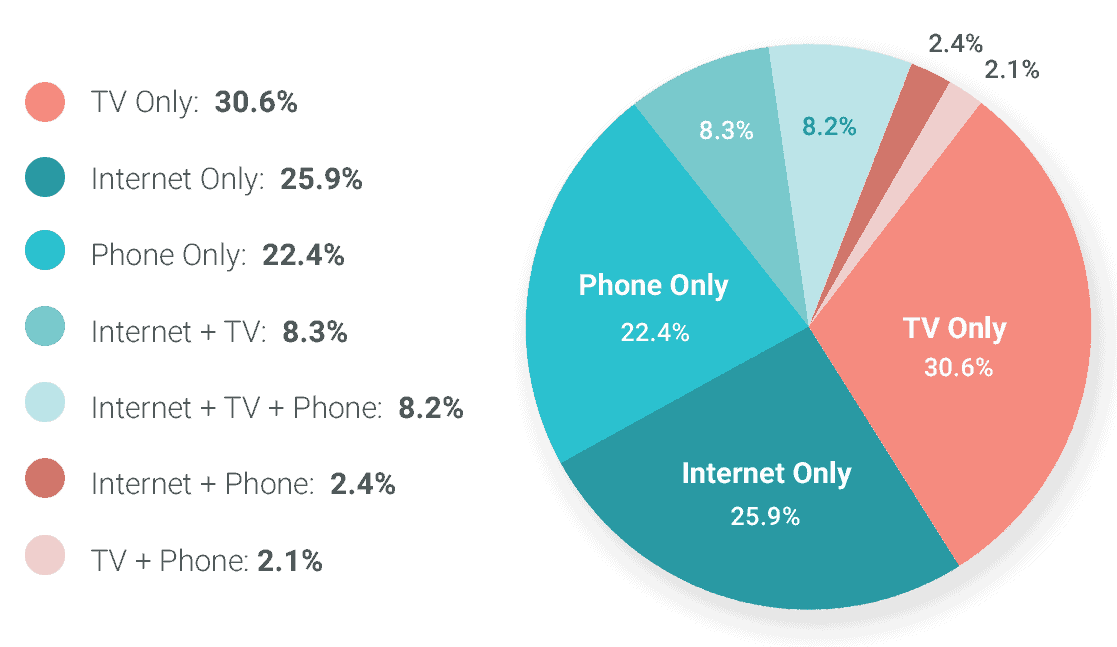
Although most shoppers only purchased one type of service last year, over 20 percent did purchase from at least two categories of home services. The most common combination purchased was internet + TV, closely followed by internet + TV + phone.
We asked shoppers who purchased from multiple categories whether they bundled their services from one provider. Over 60 percent of shoppers who purchased both internet and TV service last year purchased them from one provider. Further, more than 75 percent of consumers that purchased all three categories (internet, TV, and phone) purchased a bundle, with almost half of those consumers opting for a “Triple Play.”
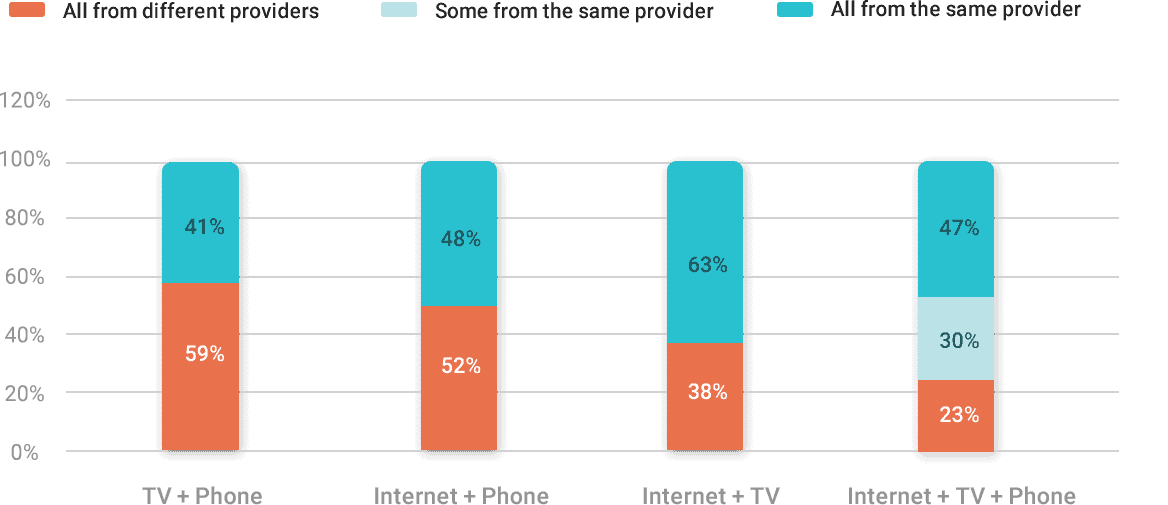
A two-service purchase combination in the same year that included phone service – either wireless or landline – with internet or TV was less likely to be from the same provider. This indicates that most of these phone service purchases were for wireless, since most home services providers tend to offer landline service in conjunction with internet and TV. This is consistent with the mobile-first approach that many consumers are taking with their phone services. This makes wireless companies’ moves to compete in the Home Service market with 5G all the more compelling, since they could market residential packages with a mobile-first pitch.
The Increasing Codependence of TV & Internet
Our most notable finding for internet service was the strong consumer demand for fiber. Fiber contributed to 18 percent of new internet sales, despite being available to just 25 percent of U.S. households. Compare this to cable internet, which is available to 89 percent of U.S. households, yet, only accounted for 44 percent of recent internet purchases in our survey.
What type of service do new internet customers have?
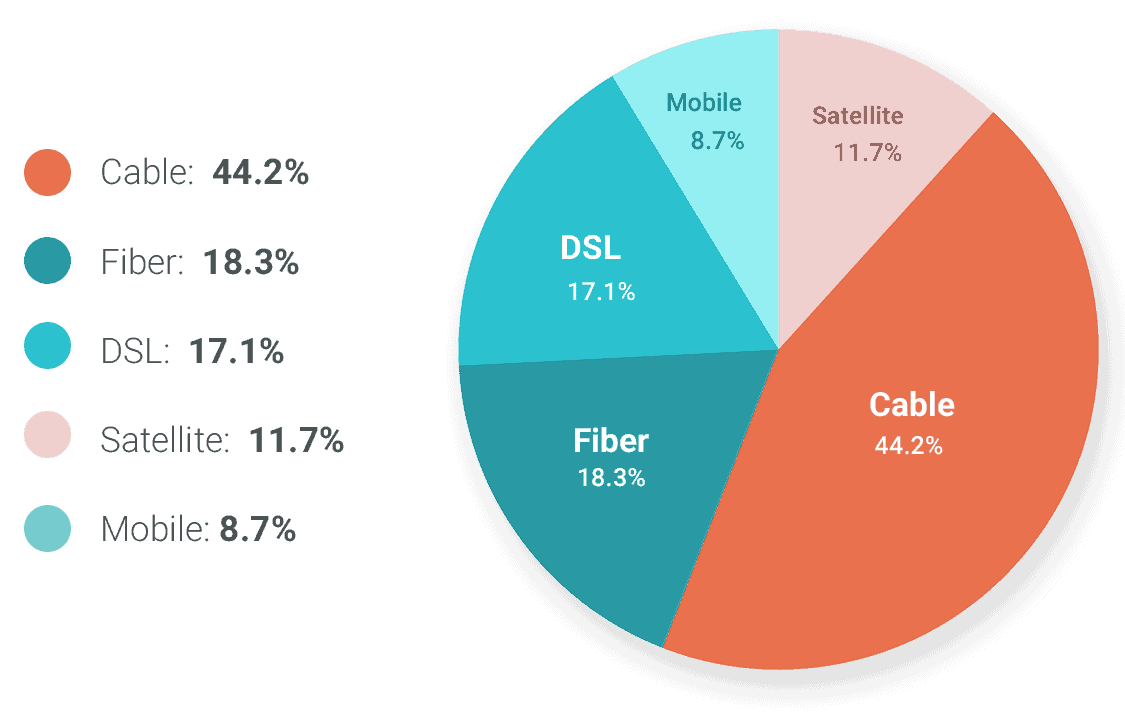
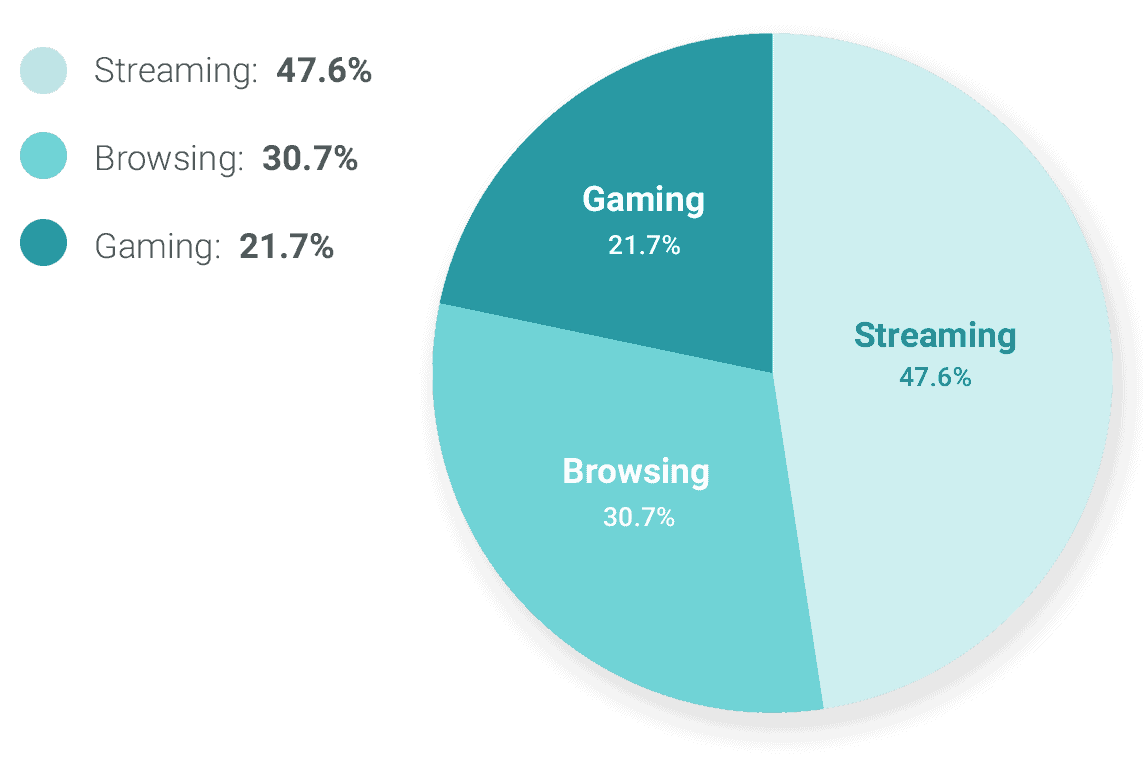
Internet shoppers indicated that they primarily use the internet for streaming video. This explicitly links internet and TV services as codependent. With fiber’s ultra-fast speeds, it is ideal for high-bandwidth activities like streaming.
Primary Internet Activity Indicated by Shopper
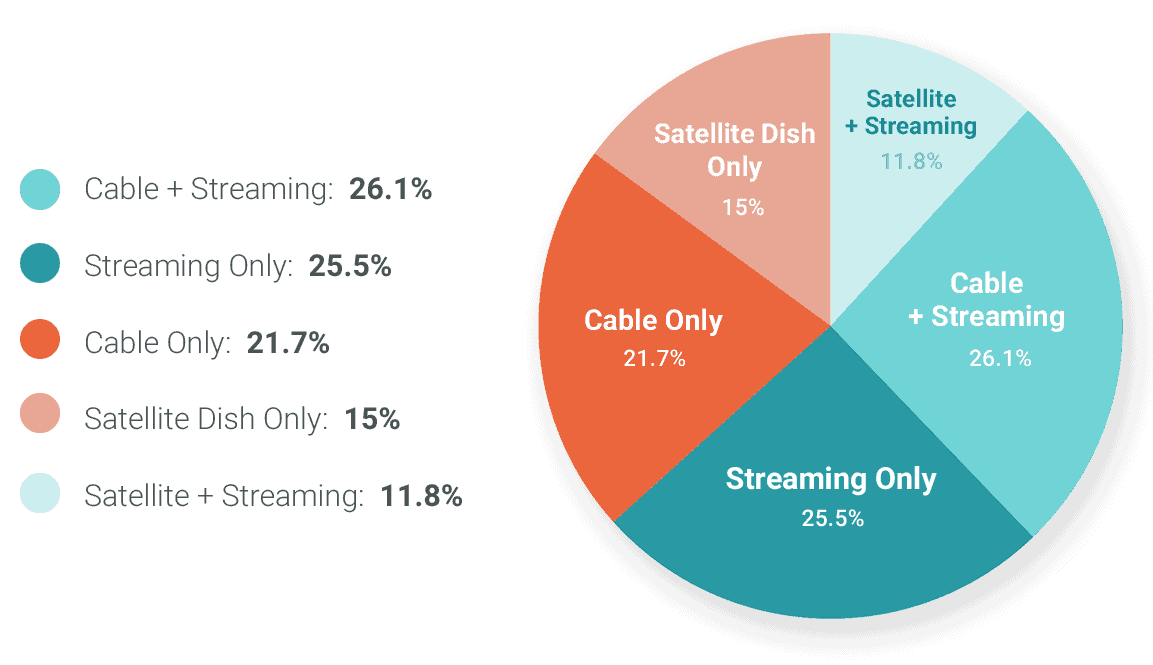
As expected, streaming services led new TV service subscriptions. Even so, 37 percent of purchases were either cable or satellite TV, indicating that consumers are still actively shopping for and comparing these services.
What Type of Service Do New TV Subscribers Have?
Why Did Consumers Add or Switch?
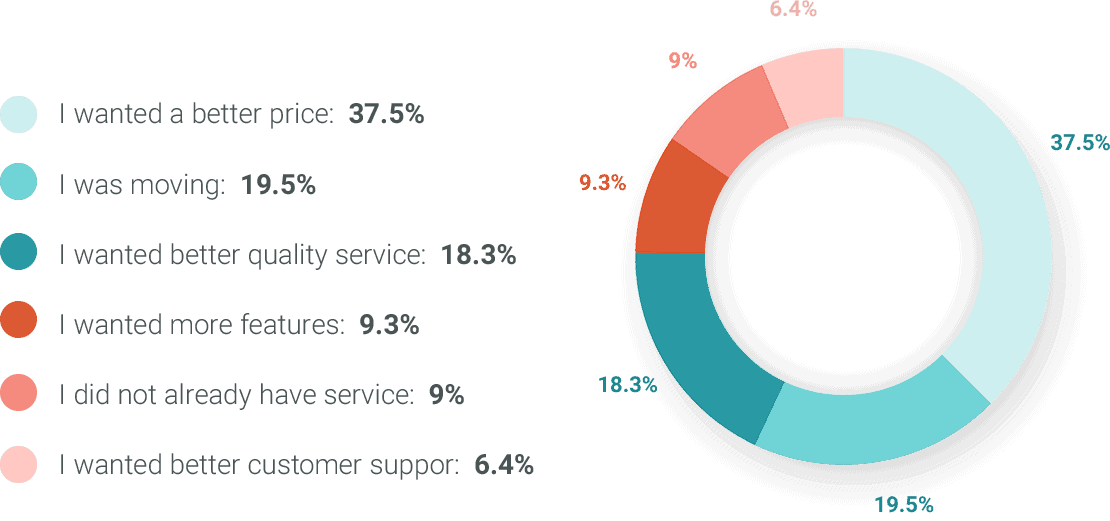
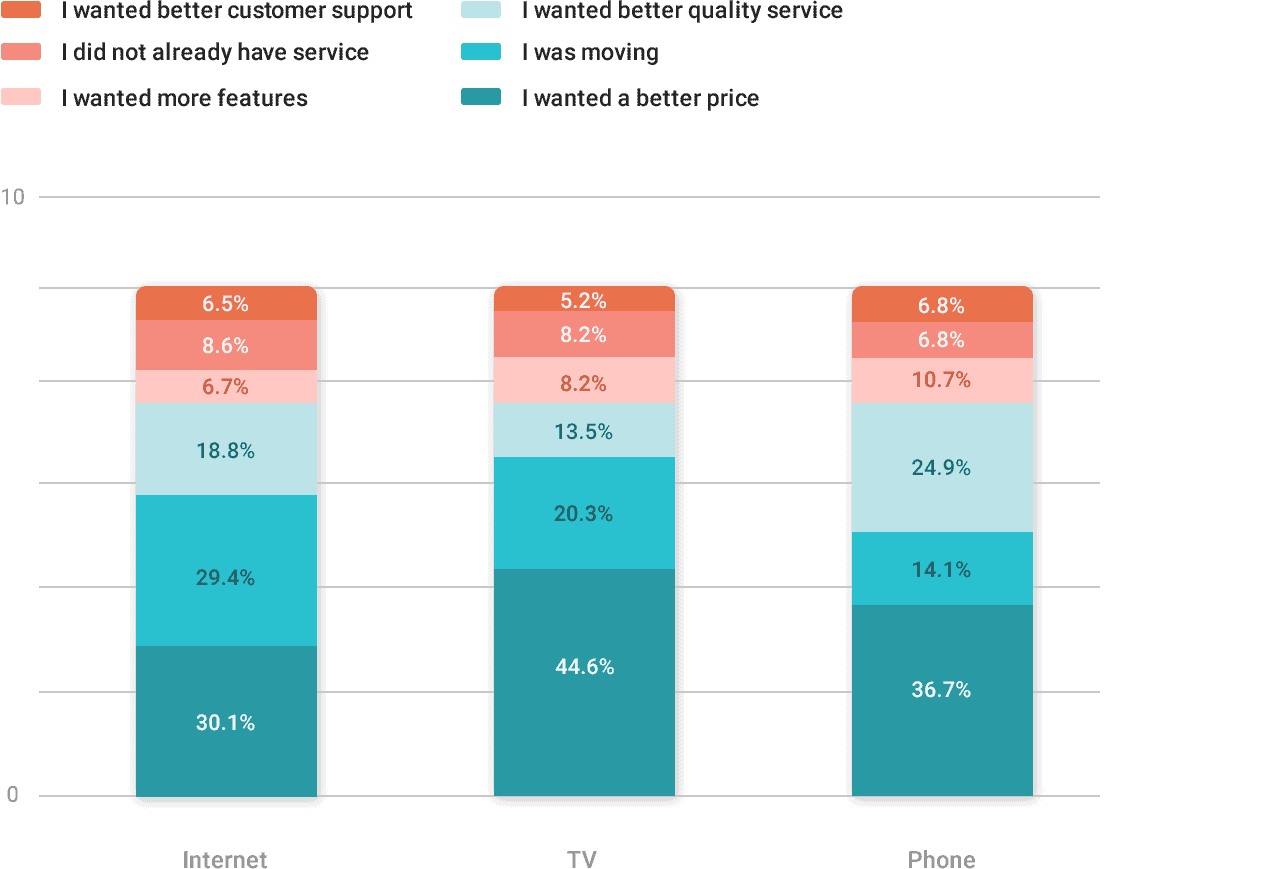
The leading reason for adding or switching home services in 2018 was price, considerably higher than any other reason, including “moving,” “features” and “service.”
Reasons for Purchasing a New Home Service in 2018
When we compare purchases across category, TV service purchasers were much more motivated by price than internet or phone purchasers, which indicates to us that consumers are more willing to forego their favorite shows or premium channels than they are to give up high-quality internet or phone service. Phone purchasers were most motivated by “better quality service.”
The Primary Reasons for Buying From Each Category
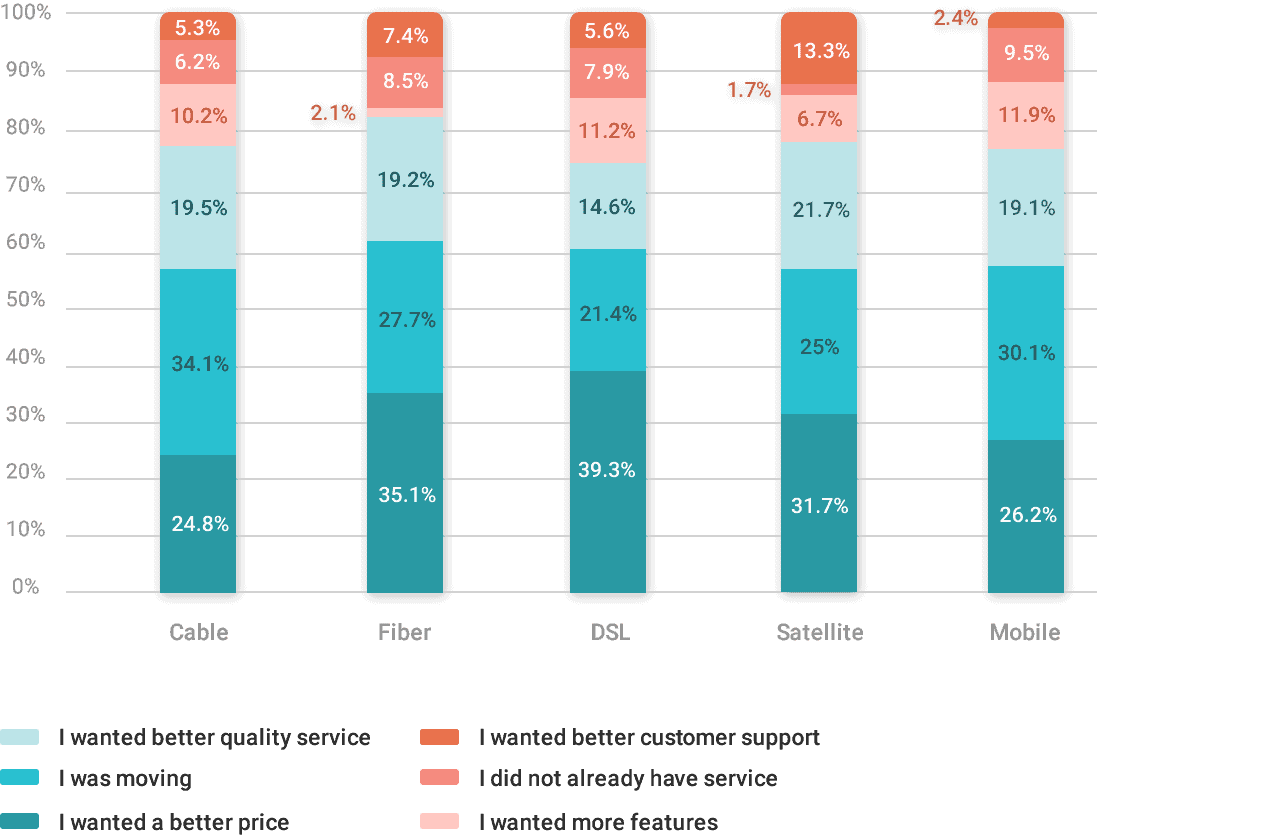
For internet purchasers, price was the primary reason for purchasing fiber, DSL, and satellite purchases. For cable or mobile purchases, moving was the primary reason.
The Primary Reason for Buying Each Type of Internet Service — Mix of Reasons Compared
Price was the biggest factor driving recent TV service purchases, with cord-cutters referencing price more than any other type of consumer across all categories.
The Primary reason for buying each type of TV service — mix of reasons compared
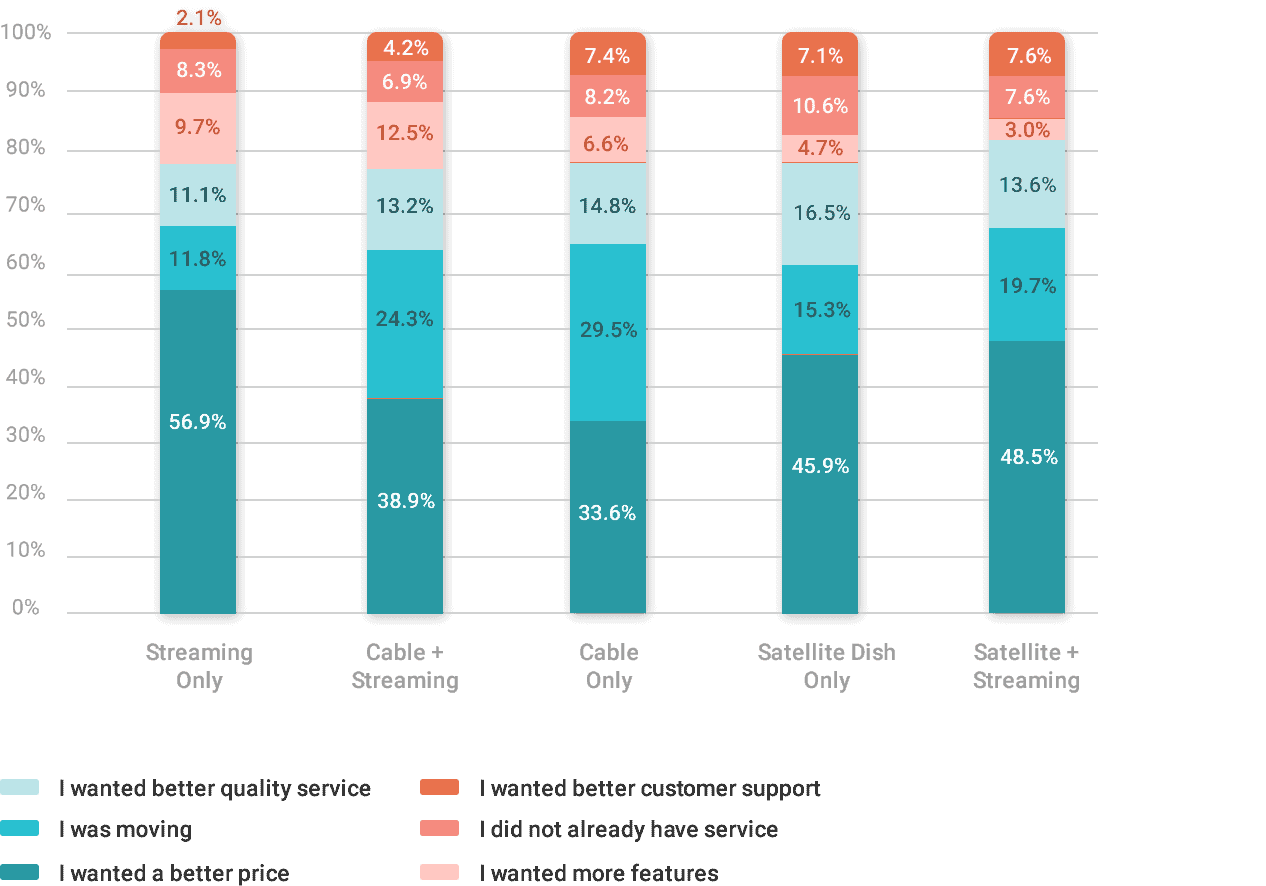
Of cable TV purchasers, moving was slightly behind price as a primary motivation. Movers are a challenge almost exclusively felt by traditional providers, who face attrition from customers leaving their service area. As cord cutting rates grow, fewer movers are replaced by new customers.
Were Customers Satisfied After Their Purchase?
With 39 million U.S. adults adding or switching service last year, how many were significantly happier as the calendar flipped to 2019? Although most adults were slightly more satisfied, we found that in many cases the grass was not greener.
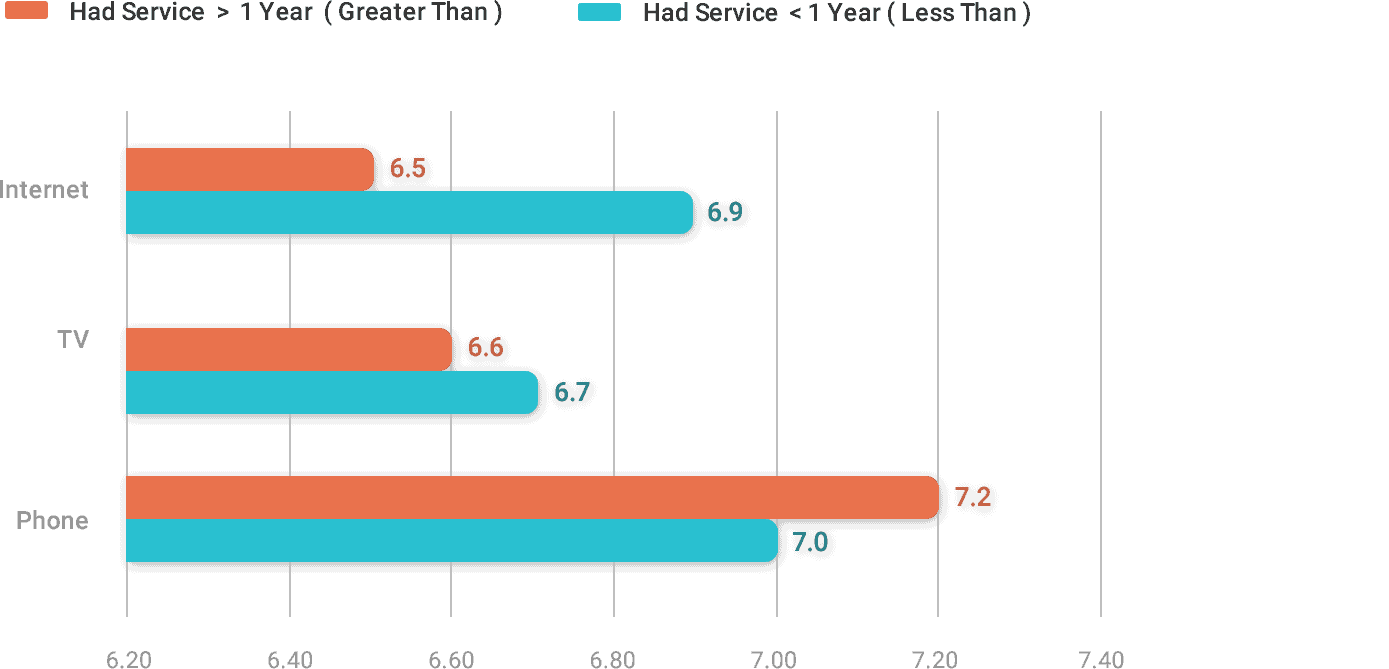
The chart below compares the satisfaction of customers who switched or purchased new service in 2018 with those who had the same type of service for over a year. Looking at TV and internet, recent purchasers were slightly more satisfied than those who didn’t switch or purchase new service last year. Recent phone purchasers, however, were less satisfied than their non-switching counterparts.
Average Customer Satisfaction by Recency of Purchase
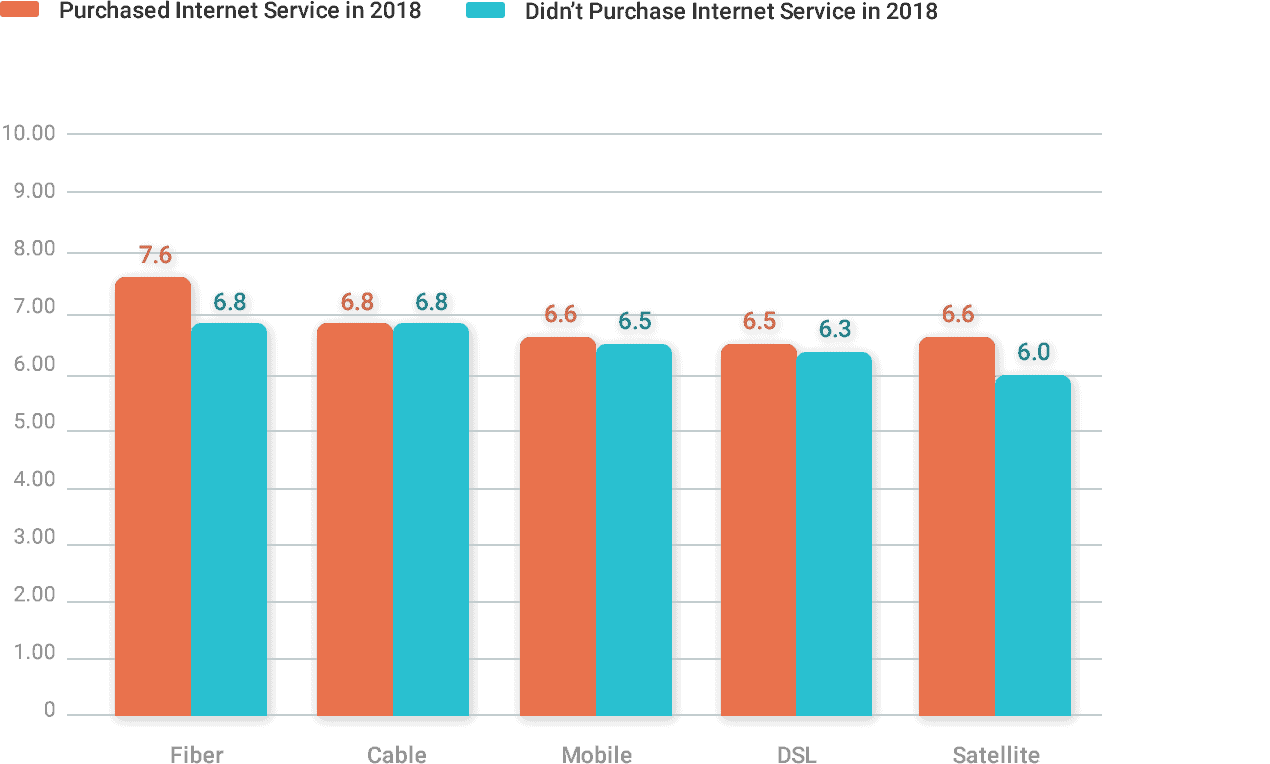
Almost all of the increase in satisfaction from internet purchases comes from fiber customers, who were the most satisfied out of all the customers we surveyed. We’ll chalk this up to higher speeds yielding happier customers.
Average Customer Satisfaction of Home Service Shoppers Who Have Internet Service
When we turn to TV, it’s official: cord-cutters are the happiest. Streaming also seemed to have a halo effect on traditional services. Having an additional streaming service made customers of traditional TV services (satellite and cable) more satisfied than those without streaming.
Average Customer Satisfaction of Home Service Shoppers Who Have TV Service
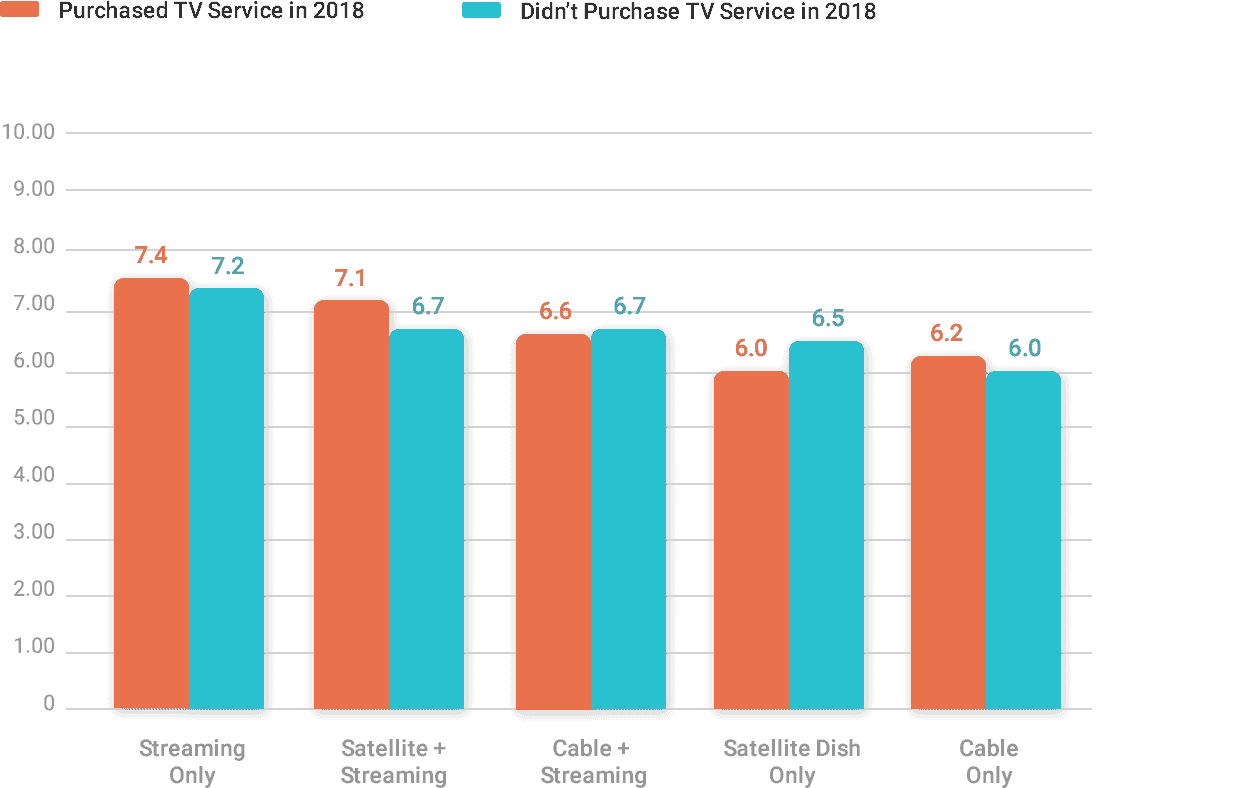
As for the “traditional” services, satellite edged out cable. Since price is the most important factor for customers purchasing TV service, a key driver of satellite customers’ increased satisfaction over cable customers could be the fact that satellite beats cable on price for basic service and often has a better dollar-to-channel ratio.
A Bundle of Joy
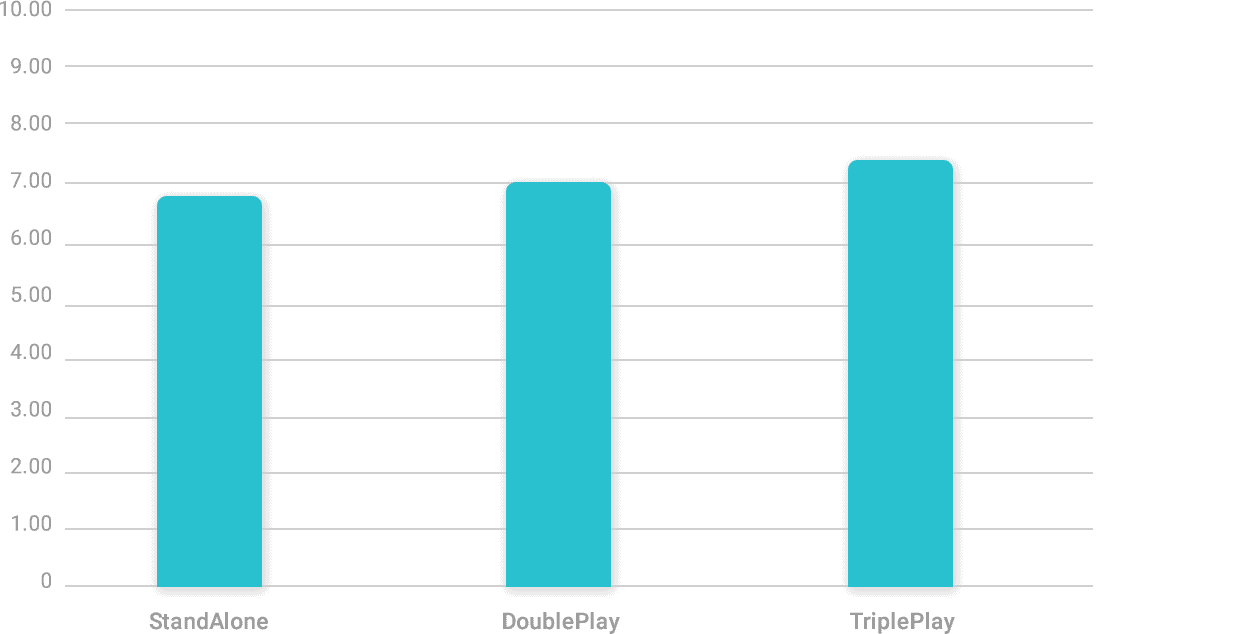
One of the most interesting findings from our survey was that when measuring the combined satisfaction across home services, customers that purchased multiple services from the same provider were much happier than those who did not. In fact, satisfaction increased with the size of the bundle, with “Triple Play” customers being the most satisfied. This further supports our notion that providers should be moving towards offering multiple types of services – streaming and wireless included.
Who Shopped For New Service?
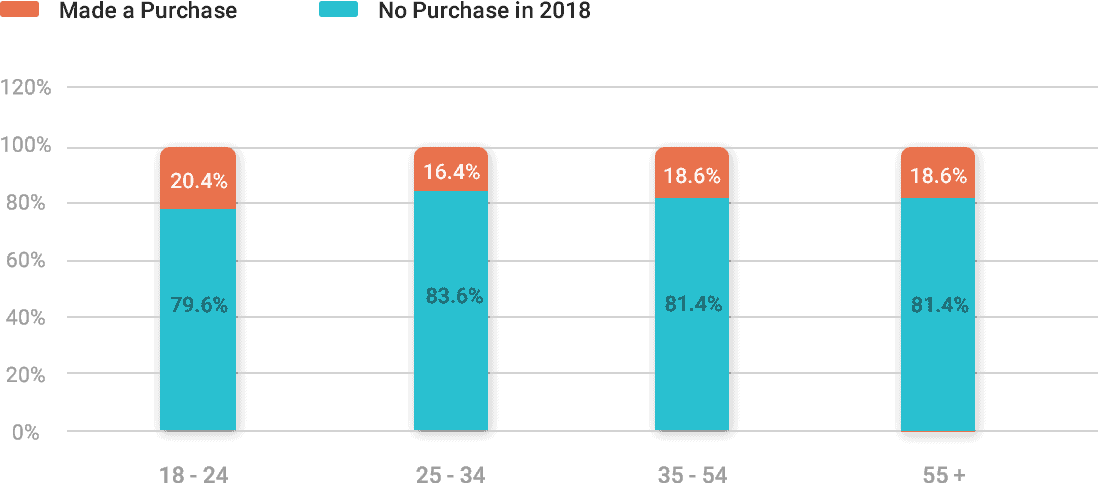
The highest rate of purchases came from consumers aged 18 to 24, who are likely to be entering the market for the first time.
Percent of Consumers Surveyed Who Made a Home Service Purchase in 2018 — Sorted by Age Group
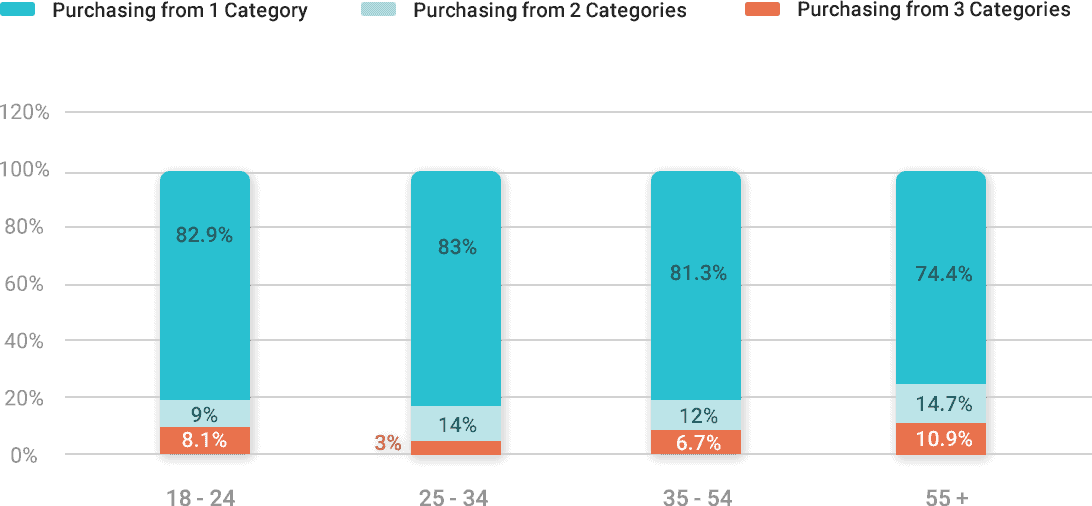
Our oldest age group, 55+, made the most multi-category purchases in the same year. They purchased significantly more “Triple Play” offerings of internet, TV, and phone services in tandem.
Likelihood of Purchasing From Multiple Categories — Sorted by Age Group