
In Spite of Speed and Infrastructure Increases, the FCC Concludes That American Price-to-Value Is High Compared to Other Developed Countries.
Are you a journalist or researcher writing about this topic?
Contact us and we'll connect you with a broadband market expert on our team who can provide insights and data to support your work.
Data in the 2018 FCC International Broadband Data Report shows that US broadband speeds have climbed the charts to #10 among developed nations. As of 2016, the US pulled ahead of Norway, Finland, and several other European countries.
However, pricing analysis in the report shows that in spite of improving speeds and infrastructure, the prices Americans pay for broadband are still “among the worst in the developed world,” amounting to an average $58/month.
The full report is available via the FCC. Our analysis focuses on what the speed and pricing results mean today for US broadband competition.
Key Broadband Speed Insights from the 2018 FCC International Broadband Data Report
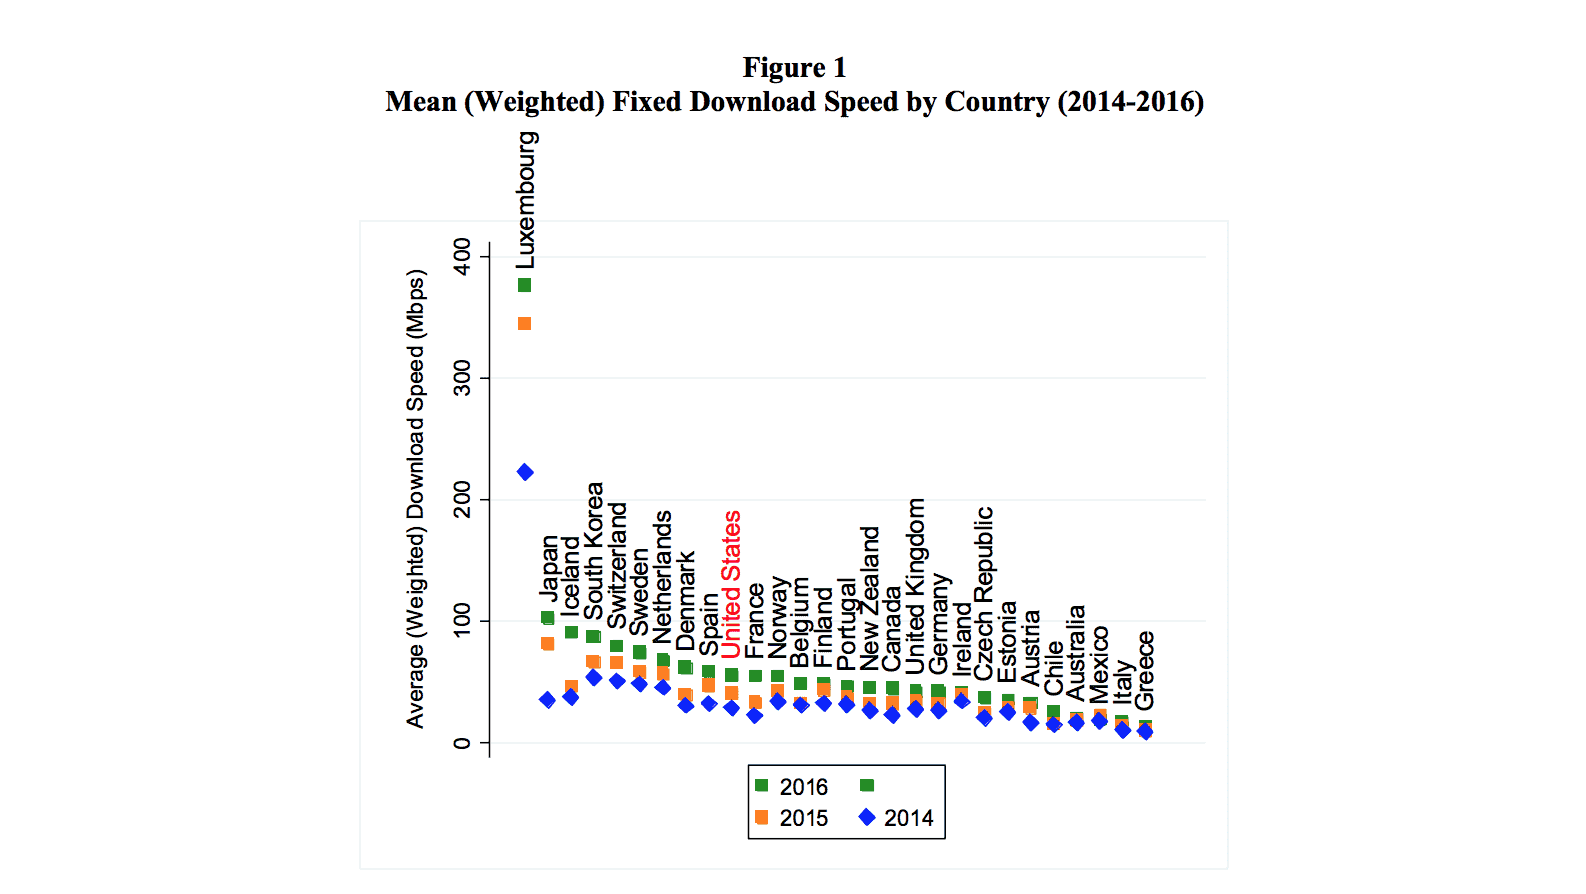
- US mean weighted fixed broadband speed international ranking advanced from #11 to #10 for years 2015–2016
- For the first time since 2014, US fixed broadband speeds exceeded those in Norway and Finland
- The US jump to #10 by 2016 is a significant jump from position #15 in 2014
- France made one of the largest improvements in speed, from #21 to #11 between 2014–2016.
Key Broadband Pricing Insights from the 2018 FCC International Broadband Data Report
- US pricing was “among the worst in the developed world,” coming in #21 at the bottom of the charts on the Fixed Hedonic Price Index (comparative price-to-value in laymen’s terms). This makes sense given the shocking lack of competition in dense, urban broadband markets like Dallas that would have multiple options and cheap prices in similarly developed nations.
- When adjusted for population density, income, and education, the US pricing rank advanced to from #21 to #14
- France also had among the best price ranking (#4)
- The average broadband price in the US market is $58.00/mo. according to FCC analysis
- An estimated 75% of US customers receive discounted Internet service in the form of “bundled” Internet/TV/phone plans
Countries Ranked by Mean (Weighted) Download Speed 2016
| Rank | Country | Average download speed |
|---|---|---|
| 1 | Luxembourg | 375.78 |
| 2 | Japan | 102.34 |
| 3 | Iceland | 90.36 |
| 4 | South Korea | 86.98 |
| 5 | Switzerland | 79.58 |
| 6 | Sweden | 73.81 |
| 7 | Netherlands | 67.54 |
| 8 | Denmark | 61.49 |
| 9 | Spain | 57.86 |
| 10 | United States | 55.07 |
How the FCC Measures Speed and Performance
Speed results in the 2018 FCC International Broadband Data Report were based on speed test data acquired via Ookla.
Opinions are varied on which speed test sources offer the best estimates of performance in a given area. (We personally use M-Labs data , which is integrated into Google search as well as BroadbandNow.)
Long term, we expect that integration with Google searches for “speed test” will make M-Labs results more valuable so far as localized performance estimates — at least within the US.
Want to dig deeper on U.S. internet speeds and access?
- Explore top internet providers by state, such as New York, Maryland, Rhode Island, and Florida.
- Search for broadband internet in your area, or see all internet providers in a city like Memphis.
- Find information on the top internet service providers in the U.S. such as CenturyLink, Verizon Fios, and Spectrum.
Pricing Measurement and Trends
The pricing measurements are detailed in the appendix of the 2018 FCC International Broadband Data Report, and worth taking a look at for the mathematically inclined. Methodology is detailed on page 52 in the report appendix.
To summarize for the rest of us: while speed rankings is based on a mix of advertised speeds and privately aggregated real-world speed test results, price rankings are based on advertised pricing from providers like Spectrum and AT&T Internet pricing. Unlike previous years, this year’s report includes bundled plans as well as Internet-only “standalone” plans, which significantly affect the results for the US market.
The “bundling” strategy used by many cable operators complicates the math for comparing nations since the regulations around “bundled” services such as Internet/TV varying from country to country.
Overall, the FCC report found that the US is the outlier in terms of the popularity of bundled plans, estimating that a surprising 75% of consumers receive discounted Internet through some form of TV and/or phone bundle.
The Density Dilemma

The US is often held up as an example of Internet infrastructure gone wrong.
Meanwhile, small and densely populated countries like South Korea are often held up as shining examples of Internet infrastructure done properly.
Is this fair? Not always, since the political, infrastructural, and economic conditions are so different in either country. It’s difficult to justify a direct pricing comparison between two radically different countries like, say, France and Japan.
Our team was encouraged to see this year’s report take a more measured stance on how population density, economic standing, and other factors play into “ranking” results. The report also took the time to describe the physical logistics of each country, making it easier to see where large rural areas or environmental issues could be holding down averages.
The 2018 Broadband Deployment Report described the USA in this way:
Slightly larger than China and more than twice the size of the European Union, the terrain is comprised of a vast central plain, mountains in the west, hills and low mountains in the east, rugged mountains and broad river valleys in Alaska, and rugged, volcanic topography in Hawaii.
One way this year’s report dealt with this issue was by categorizing pricing results in the hedonic price index into four “models,” with detailed explanations of the math used to weigh for factors including:
- Population density of country
- Income of subscriber base
- Education of subscriber base
The model cited in the “key insights” section above draws from the model that measured for population density, income levels, and education levels.
The #14 ranking in this model still didn’t paint a very flattering picture of US pricing for services. Regardless, it puts the US squarely in the center of the charts rather than at the very bottom.
Prospects Improving for Broadband Competition
While their methods for achieving it are dramatically different, FCC chairmen under both Trump and Obama have made increasing competition and closing the digital divide key priorities for their work.
Partisan disagreements aside, seeing the US rankings improve over the past five years (particularly in states like New York and Illinois where service has improved rapidly in Brooklyn and Chicago) has been encouraging for everyone involved. Wireless and fiber development alongside an emphasis on federal funding for closing the digital divide are expected to continue improving broadband availability and pricing over the coming years.
Since this data is often a year or more behind the times by the time it reaches the public through FCC releases, we’ll have to wait until later in 2018 to find out how the scoreboards react to the current deregulatory approach to solving these critical challenges in American infrastructure development.