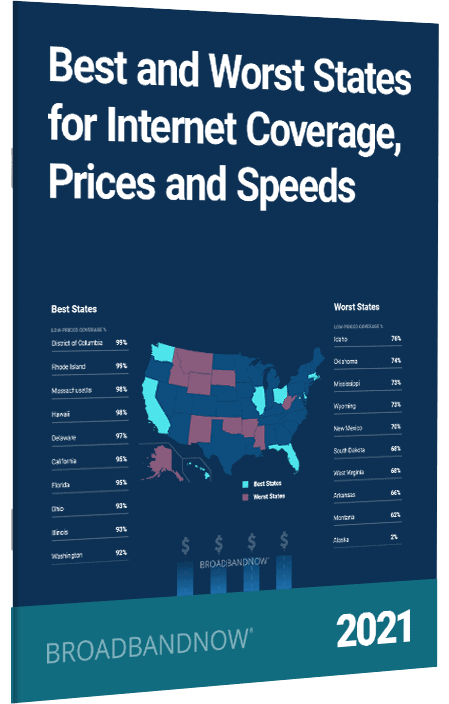
Key Findings
- This year, New Jersey falls from 1st to 6th overall as Washington D.C. takes the top position.
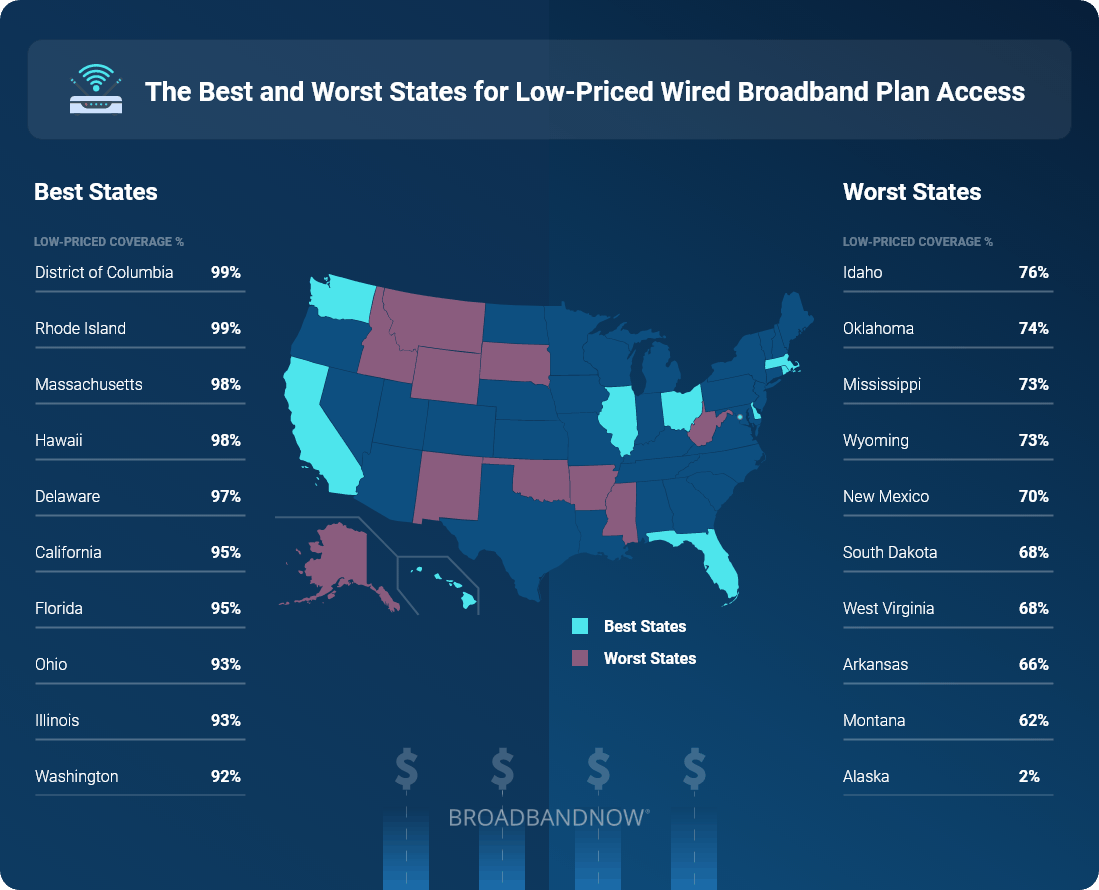
- Likewise, Alaska has risen from 51st place last year to 49, rising from 61% broadband coverage to 67.5% and for the first time, 2.3% low-priced broadband coverage.
- Large states like Texas and California fell significantly in standing from last year, going from 8th to 19th and 13th to 24th, respectively.
- Washington D.C. edges out New jersey as the state with the most widespread low-priced broadband availability this year, though both have over 98% coverage.
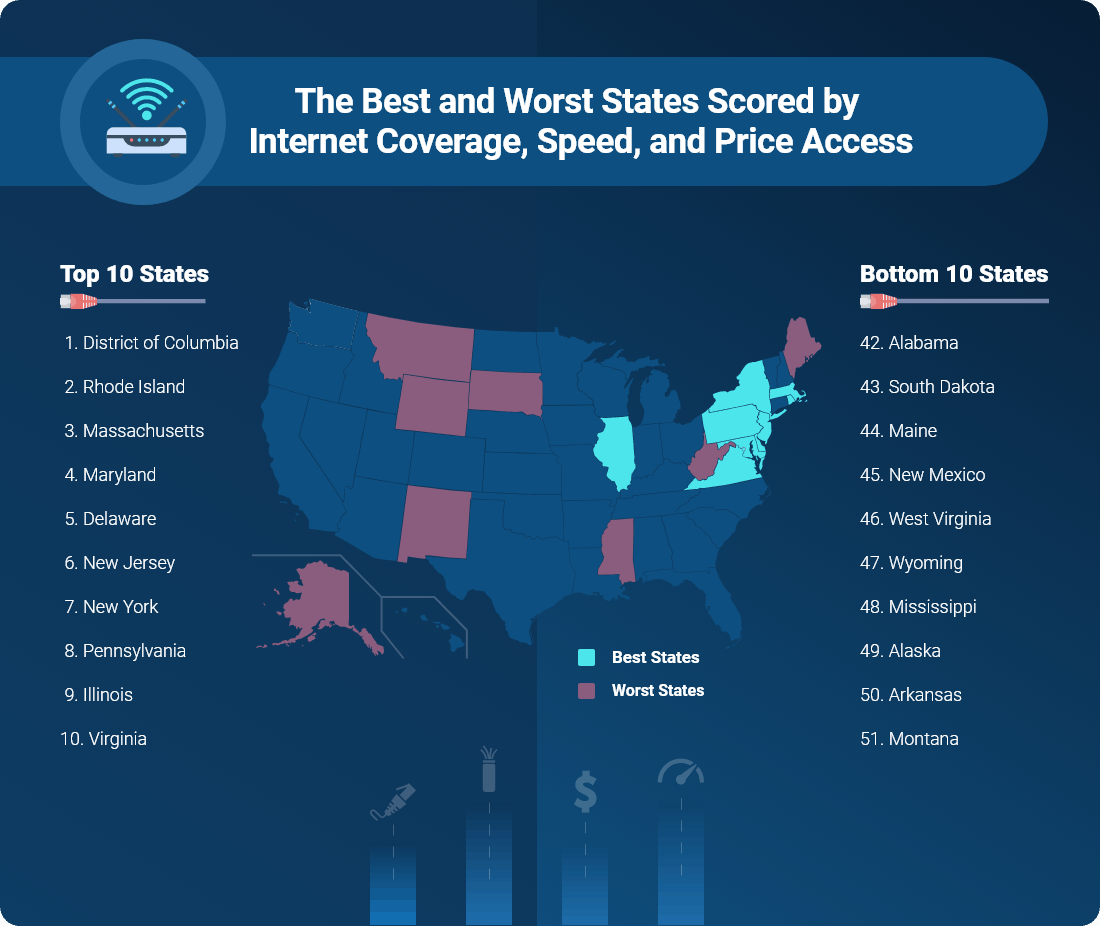
State Rankings
Below, you’ll find each state in the U.S. ranked for the overall strength of its broadband ecosystem.
#1
District of Columbia
-
Terrestrial Broadband Access:
98.0%
-
Wired Low-Priced Plan Access:
98.8%
-
Average Speed Test:
473.8 Mbps
-
76
#2
Rhode Island
-
Terrestrial Broadband Access:
97.0%
-
Wired Low-Priced Plan Access:
98.7%
-
Average Speed Test:
433.3 Mbps
-
38
#3
Delaware
-
Terrestrial Broadband Access:
95.5%
-
Wired Low-Priced Plan Access:
96.8%
-
Average Speed Test:
469.7 Mbps
-
51
#4
Maryland
-
Terrestrial Broadband Access:
96.3%
-
Wired Low-Priced Plan Access:
90.6%
-
Average Speed Test:
506.7 Mbps
-
133
#5
Massachusetts
-
Terrestrial Broadband Access:
97.5%
-
Wired Low-Priced Plan Access:
97.7%
-
Average Speed Test:
401.2 Mbps
-
128
#6
New Jersey
-
Terrestrial Broadband Access:
95.5%
-
Wired Low-Priced Plan Access:
90.4%
-
Average Speed Test:
427.8 Mbps
-
131
#7
Pennsylvania
-
Terrestrial Broadband Access:
91.6%
-
Wired Low-Priced Plan Access:
90.3%
-
Average Speed Test:
430.8 Mbps
-
224
#8
New York
-
Terrestrial Broadband Access:
93.8%
-
Wired Low-Priced Plan Access:
90.9%
-
Average Speed Test:
397.7 Mbps
-
222
#9
Washington
-
Terrestrial Broadband Access:
83.8%
-
Wired Low-Priced Plan Access:
91.9%
-
Average Speed Test:
451.0 Mbps
-
251
#10
Virginia
-
Terrestrial Broadband Access:
89.3%
-
Wired Low-Priced Plan Access:
86.4%
-
Average Speed Test:
505.6 Mbps
-
206
#11
Illinois
-
Terrestrial Broadband Access:
90.6%
-
Wired Low-Priced Plan Access:
92.5%
-
Average Speed Test:
324.9 Mbps
-
350
#12
Nevada
-
Terrestrial Broadband Access:
94.2%
-
Wired Low-Priced Plan Access:
90.7%
-
Average Speed Test:
334.6 Mbps
-
131
#13
Connecticut
-
Terrestrial Broadband Access:
89.2%
-
Wired Low-Priced Plan Access:
91.1%
-
Average Speed Test:
314.6 Mbps
-
77
#14
Colorado
-
Terrestrial Broadband Access:
88.8%
-
Wired Low-Priced Plan Access:
87.7%
-
Average Speed Test:
347.0 Mbps
-
254
#15
Florida
-
Terrestrial Broadband Access:
89.2%
-
Wired Low-Priced Plan Access:
94.7%
-
Average Speed Test:
322.3 Mbps
-
233
#16
Utah
-
Terrestrial Broadband Access:
93.0%
-
Wired Low-Priced Plan Access:
92.1%
-
Average Speed Test:
314.1 Mbps
-
142
#17
Ohio
-
Terrestrial Broadband Access:
88.2%
-
Wired Low-Priced Plan Access:
93.0%
-
Average Speed Test:
278.3 Mbps
-
280
#18
Michigan
-
Terrestrial Broadband Access:
86.9%
-
Wired Low-Priced Plan Access:
90.0%
-
Average Speed Test:
334.1 Mbps
-
270
#19
Indiana
-
Terrestrial Broadband Access:
87.0%
-
Wired Low-Priced Plan Access:
86.3%
-
Average Speed Test:
331.0 Mbps
-
261
#20
Arizona
-
Terrestrial Broadband Access:
88.4%
-
Wired Low-Priced Plan Access:
86.1%
-
Average Speed Test:
396.1 Mbps
-
176
#21
Texas
-
Terrestrial Broadband Access:
84.9%
-
Wired Low-Priced Plan Access:
87.0%
-
Average Speed Test:
425.9 Mbps
-
550
#22
Tennessee
-
Terrestrial Broadband Access:
81.4%
-
Wired Low-Priced Plan Access:
87.9%
-
Average Speed Test:
351.1 Mbps
-
213
#23
North Carolina
-
Terrestrial Broadband Access:
85.4%
-
Wired Low-Priced Plan Access:
91.2%
-
Average Speed Test:
312.5 Mbps
-
188
#24
Georgia
-
Terrestrial Broadband Access:
82.7%
-
Wired Low-Priced Plan Access:
86.3%
-
Average Speed Test:
414.9 Mbps
-
235
#25
California
-
Terrestrial Broadband Access:
90.1%
-
Wired Low-Priced Plan Access:
95.3%
-
Average Speed Test:
93.0 Mbps
-
394
#26
Kansas
-
Terrestrial Broadband Access:
88.9%
-
Wired Low-Priced Plan Access:
81.8%
-
Average Speed Test:
325.7 Mbps
-
245
#27
Wisconsin
-
Terrestrial Broadband Access:
89.6%
-
Wired Low-Priced Plan Access:
84.4%
-
Average Speed Test:
277.1 Mbps
-
233
#28
Oregon
-
Terrestrial Broadband Access:
85.2%
-
Wired Low-Priced Plan Access:
87.5%
-
Average Speed Test:
316.9 Mbps
-
242
#29
South Carolina
-
Terrestrial Broadband Access:
77.4%
-
Wired Low-Priced Plan Access:
81.4%
-
Average Speed Test:
373.4 Mbps
-
121
#30
Nebraska
-
Terrestrial Broadband Access:
91.6%
-
Wired Low-Priced Plan Access:
77.4%
-
Average Speed Test:
270.0 Mbps
-
198
#31
Minnesota
-
Terrestrial Broadband Access:
85.1%
-
Wired Low-Priced Plan Access:
86.1%
-
Average Speed Test:
304.2 Mbps
-
282
#32
Vermont
-
Terrestrial Broadband Access:
71.4%
-
Wired Low-Priced Plan Access:
82.5%
-
Average Speed Test:
408.2 Mbps
-
67
#33
New Hampshire
-
Terrestrial Broadband Access:
82.2%
-
Wired Low-Priced Plan Access:
84.8%
-
Average Speed Test:
317.9 Mbps
-
70
#34
Missouri
-
Terrestrial Broadband Access:
83.7%
-
Wired Low-Priced Plan Access:
77.3%
-
Average Speed Test:
293.4 Mbps
-
270
#35
North Dakota
-
Terrestrial Broadband Access:
84.2%
-
Wired Low-Priced Plan Access:
81.4%
-
Average Speed Test:
244.3 Mbps
-
100
#36
Iowa
-
Terrestrial Broadband Access:
88.8%
-
Wired Low-Priced Plan Access:
79.7%
-
Average Speed Test:
193.9 Mbps
-
449
#37
Alabama
-
Terrestrial Broadband Access:
75.1%
-
Wired Low-Priced Plan Access:
80.4%
-
Average Speed Test:
344.6 Mbps
-
156
#38
Oklahoma
-
Terrestrial Broadband Access:
77.2%
-
Wired Low-Priced Plan Access:
73.8%
-
Average Speed Test:
351.0 Mbps
-
212
#39
Hawaii
-
Terrestrial Broadband Access:
54.1%
-
Wired Low-Priced Plan Access:
97.5%
-
Average Speed Test:
221.4 Mbps
-
46
#40
Louisiana
-
Terrestrial Broadband Access:
74.4%
-
Wired Low-Priced Plan Access:
84.8%
-
Average Speed Test:
324.9 Mbps
-
135
#41
Kentucky
-
Terrestrial Broadband Access:
81.9%
-
Wired Low-Priced Plan Access:
81.3%
-
Average Speed Test:
261.8 Mbps
-
187
#42
Idaho
-
Terrestrial Broadband Access:
87.0%
-
Wired Low-Priced Plan Access:
76.3%
-
Average Speed Test:
230.1 Mbps
-
149
#43
Maine
-
Terrestrial Broadband Access:
79.7%
-
Wired Low-Priced Plan Access:
86.2%
-
Average Speed Test:
205.2 Mbps
-
85
#44
South Dakota
-
Terrestrial Broadband Access:
86.1%
-
Wired Low-Priced Plan Access:
67.9%
-
Average Speed Test:
191.7 Mbps
-
120
#45
New Mexico
-
Terrestrial Broadband Access:
79.4%
-
Wired Low-Priced Plan Access:
71.6%
-
Average Speed Test:
288.7 Mbps
-
144
#46
Wyoming
-
Terrestrial Broadband Access:
82.6%
-
Wired Low-Priced Plan Access:
74.7%
-
Average Speed Test:
203.2 Mbps
-
88
#47
West Virginia
-
Terrestrial Broadband Access:
51.8%
-
Wired Low-Priced Plan Access:
67.4%
-
Average Speed Test:
273.2 Mbps
-
89
#48
Mississippi
-
Terrestrial Broadband Access:
59.1%
-
Wired Low-Priced Plan Access:
73.2%
-
Average Speed Test:
226.0 Mbps
-
120
#49
Alaska
-
Terrestrial Broadband Access:
67.5%
-
Wired Low-Priced Plan Access:
2.3%
-
Average Speed Test:
285.1 Mbps
-
82
#50
Arkansas
-
Terrestrial Broadband Access:
69.2%
-
Wired Low-Priced Plan Access:
66.4%
-
Average Speed Test:
230.4 Mbps
-
150
#51
Montana
-
Terrestrial Broadband Access:
77.1%
-
Wired Low-Priced Plan Access:
61.8%
-
Average Speed Test:
110.5 Mbps
-
126
Methodology
Instead of simply using government broadband data, which has widespread issues of over-reporting, we’ve taken our own corrected availability data and combined it with pricing and speed data from sources listed below to create our rankings for 2021. The methodology remains unchanged from last year’s report.
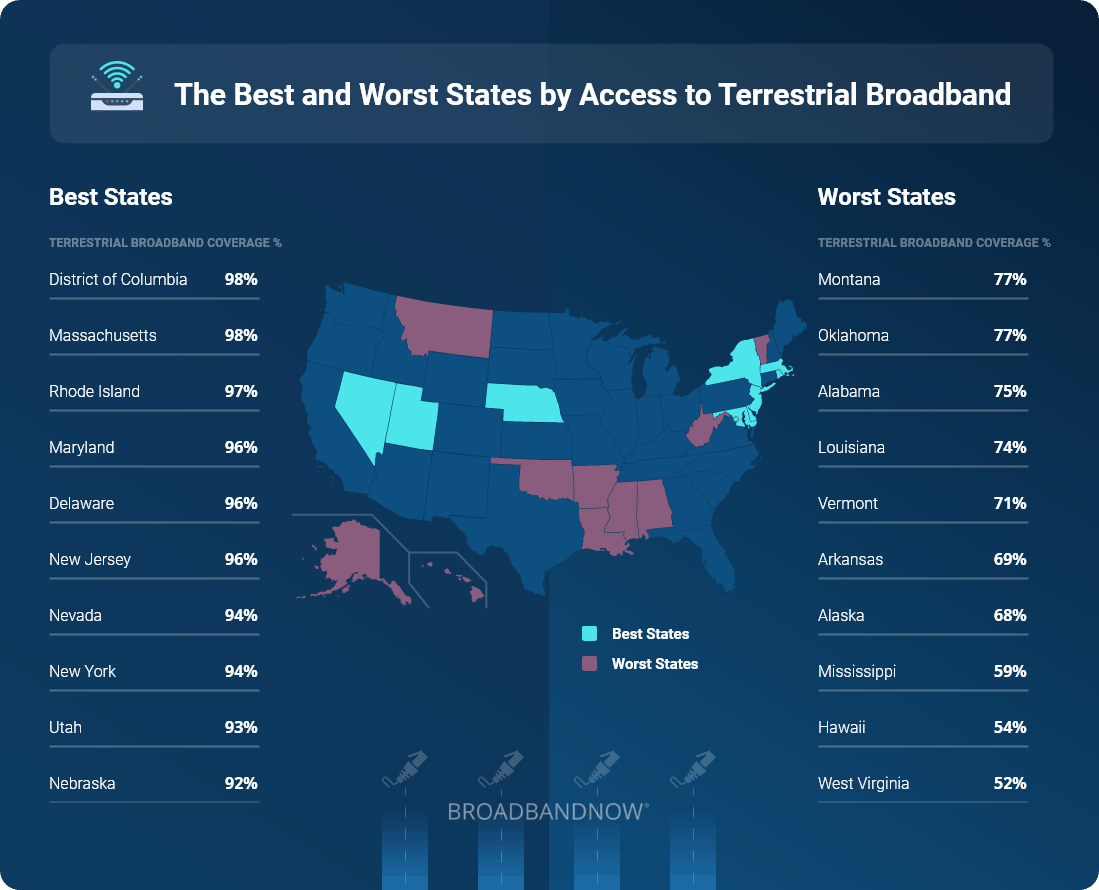
Coverage Data
For our metric “Terrestrial Broadband Coverage” which includes both wired and fixed wireless technologies, we relied on the coverage estimates we calculated from our study “FCC Reports Broadband Unavailable to 21.3 Million Americans, BroadbandNow Study Indicates 42 Million Do Not Have Access”.
For our other state level coverage rankings we calculated coverage at the census block level, similar to how our quarterly reports are calculated. Since each census block is also tied to its parent state, we have aggregated coverage directly from the block to the state level.
Pricing Data
If broadband internet was available in a given census block, we calculated the minimum price available to that block. This “minimum available price” was determined by finding the lowest cost price for standalone internet plans offered by a given provider. Both national and regional plans were considered.
Additionally, regional plans were tagged to individual zip codes. In the event that a census block was within a zip that matched the regional plan’s coverage, it was considered to have that plan available. We utilized standard, non-promotional monthly prices, only considering the promotional prices if there was no monthly price publicly available.
Our threshold for “low-priced plan” was established by using the 20th percentile of all currently available standalone internet plans, which was $59.95 (rounded to $60). If the minimum priced plan available to a block was $60 or less, we counted that block’s population as having access.
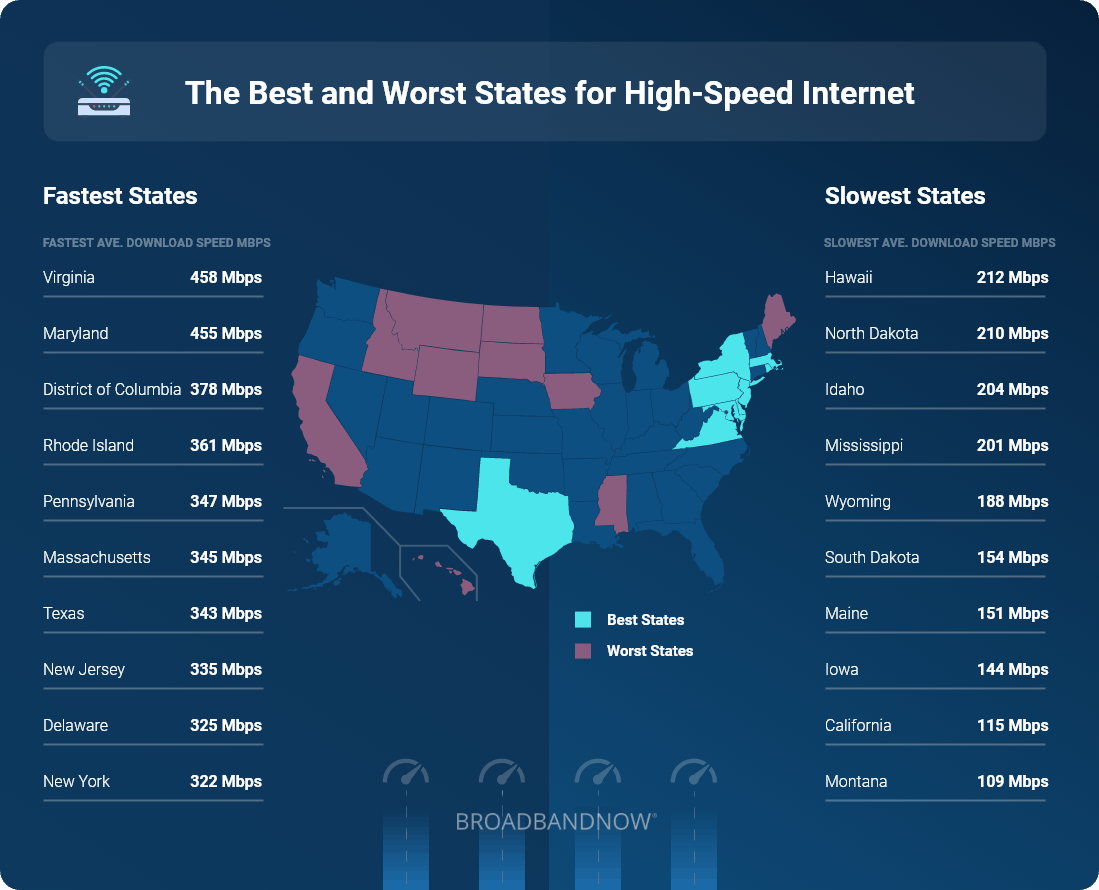
Speed Test Data
For speed tests, our rankings utilized the “fastest average speed” data from MLabs, which represents the average of all the tests that fell into the 90th percentile of speeds.
State Rankings
To rank the states, we organized cities in them from best to worst in each of the following metrics: access to broadband (including satellite), access to terrestrial broadband, access to low-priced wired broadband plans and average MLabs download speed. Each of these was pulled from a mixture of public and private data sources, including the FCC’s Form 477 deployment reports and our own internal provider database.
Scoring
To score each state, we used the following weighted blend of data:
- 30% Terrestrial Broadband Access Rank
- 30% Wired Low-Priced Plan Access Rank
- 30% Speed Test Rank
- 5% Broadband Access Rank (includes non-wired)
- 5% Low-Priced Plan Access Rank (includes non-wired)
About the Data
Terrestrial Broadband Coverage %: The percent of a given state’s population that we estimate to have access to wired (DSL, Copper, Cable, Fiber) or fixed wireless internet of at least 25 Mbps download and 3 Mbps upload. Coverage was estimated for our our study “FCC Reports Broadband Unavailable to 21.3 Million Americans, BroadbandNow Study Indicates 42 Million Do Not Have Access” where we manually checking over 11 thousand addresses randomly selected across the United States to test if the FCC’s coverage of their location was accurate or not.
Broadband Coverage %: The percent of a given state’s population that has access to an internet connection of any technology of at least 25 Mbps download and 3 Mbps upload. Coverage is calculated at the census block level and aggregated.
Fastest Average Speed: The average of all speed test results that were in the top 90th percentile in a given state. These tests reflect download speed alone, and are the result of a 12-month rolling average.
Low-Priced Plan Coverage % (Wired Broadband): The percent of the state’s population that has access to wired (DSL, Copper, Cable, Fiber) of at least 25 Mbps download and 3 Mbps upload AND a standalone internet broadband speed plan that is $60 or less per month (regular monthly price). Coverage is calculated at the census block level and aggregated.
Low-Priced Plan Coverage % (Broadband): The percent of the state’s population that has access to an internet connection of any technology of at least 25 Mbps download and 3 Mbps upload AND a standalone internet broadband speed plan that is $60 or less per month (regular monthly price). Coverage is calculated at the census block level and aggregated.

Written by