
Low Earth Orbit (LEO) satellites are still in their nascency, but analysis of BroadbandNow US market pricing data suggests that the technology could save American households more than $30 billion per year by intensifying broadband competition.
LEO satellites, such as the constellations planned by Elon Musk’s SpaceX Starlink project and Jeff Bezos’ Project Kuiper, promise to bring low-latency broadband internet to millions of Americans. LEO satellite orbit extremely close to earth, between 99 to 1200 miles versus 22,000 miles of traditional satellite internet, which means less time to transfer information (lower latency) and a quality of service comparable to wired broadband cable and fiber providers. The arrays will be precisely mapped into massive constellations to maximize coverage.
LEO technology will offer robust internet access to underserved and rural communities lacking wired, low-latency broadband options. The arrival of this emergent technology is likely to drive down monthly internet prices for hundreds of millions of Americans.
Competition Drives Down Pricing
Americans with access to multiple broadband-level options for internet service tend to pay lower prices on average than those who have just one option in their area.
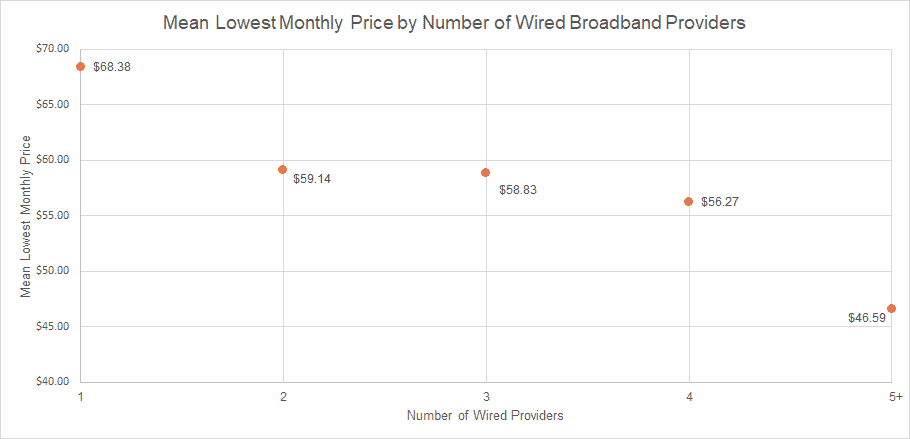
According to analysis of BroadbandNow’s market-wide pricing database covering plans and pricing from more than 2,000 ISPs, the average “lowest available monthly price” for the estimated 104 million Americans with only one wired broadband provider is $68. For the 75 million Americans with two choices, that average lowest price drops to $59. For the lucky 15 million Americans with five or more choices, it’s $47.
The chart below illustrates this effect. Because LEO technology will ostensibly be available everywhere in the US, this indicates the powerful influence the entrance of the technology will have on internet prices as new markets gain access to an additional true “broadband” option and competition heats up.
Mean Average Lowest Monthly Price by Number of Internet Providers
Adding LEO Satellite to the Mix Can Save Americans $30 Billion +
Our projections show that that low-latency, LEO satellite internet is likely to have a similar impact on average regional prices as wired, low-latency wired providers. Extrapolating this additional competitor across all US households, the introduction of LEO satellite internet could save Americans over $30 billion.
If we assume that just Elon Musk’s Starlink launches, then the 263 million Americans with three or fewer wired broadband providers in their area could collectively save over $14 billion through reduced monthly prices (according to the chart above). The remainder of Americans with four or more providers could save an additional $4 Billion, pushing the savings to $18 billion.
If both Starlink and Project Kuiper launch, the savings is likely to be even more dramatic, which we estimate to be more than $30 billion as Americans have two additional choices. The chart below shows the population by number of wired broadband providers. As an appendix to this report, you can see a table with additional detail, including pricing.
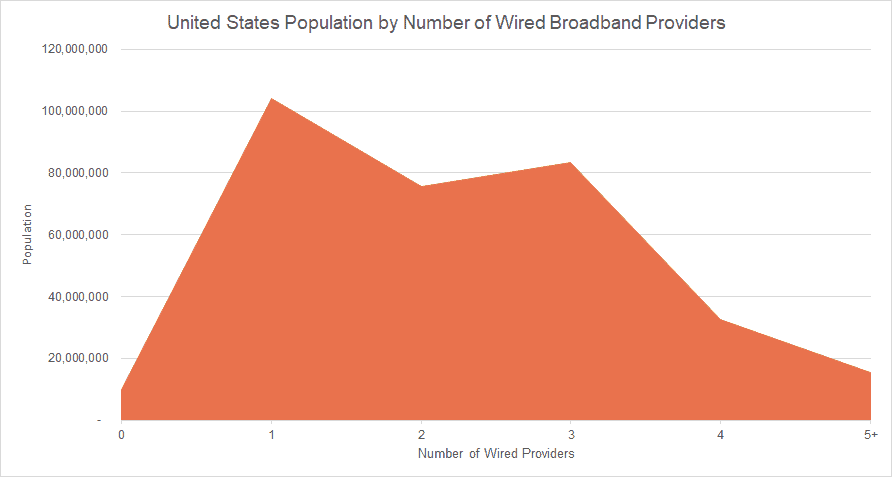
Finally, Americans who currently have no wired providers, or no providers at all, will have access to high performing internet, bridging the digital divide and bringing around 10 million Americans up to speed with the rest of the nation.
Appendix
| Number of Wired Providers | Population Covered | Number of Zip Codes | Mean Lowest Priced Wired Broadband Plan |
|---|---|---|---|
| 0 | 9,836,029 | 8,989 | |
| 1 | 104,142,401 | 12,259 | $68.38 |
| 2 | 75,548,052 | 6,246 | $59.14 |
| 3 | 83,380,772 | 3,760 | $58.83 |
| 4 | 32,520,715 | 1,250 | $56.27 |
| 5+ | 15,563,255 | 485 | $46.59 |
| Grand Total | 320,991,224 | 32,989 | $63.40 |
About BroadbandNow Data
BroadbandNow pricing data referenced in this study is drawn from our market-wide database of plan speeds and pricing. This data is collected manually from provider websites and completely renewed every two months. In some cases pricing may be supplied directly by providers. Average pricing is calculated from this database. Coverage data is calculated by performing validation on top of FCC Form 477 coverage data at the census block level. For the purpose of this study, blocks were grouped at the zip-code level.
BroadbandNow pricing data referenced in this study is drawn from our market-wide database of plan speeds and pricing for wired (Cable, Fiber, DSL) providers offering plans with at least the minimum level broadband speeds as defined by the FCC (25 Mbps download, 3 Mbps upload). For this study we took the lowest priced plan per zip, as well as the number of providers available in that zip serving at least 2% of the zip’s population, and then computed the average of these prices to get the average lowest price plan per number of wired providers segment. Coverage data is calculated by performing validation on top of FCC Form 477 coverage data at the census block level. For the purpose of this study, blocks were grouped at the zip-code level.