
As America settles into a new normal, millions of workers and young learners are now relying on their home internet connections to stay productive. These networks continue to face disruptions in cities and towns in all corners of the nation, though the majority of the degradations remain minor.
This is our fifth report tracking internet speeds across the top 200 most populous U.S. cities, as well as in hundreds of rural communities. Our two most recent reports seemed to indicate that networks were slowly adjusting to the newfound demand being placed on them, but this week, these improvements have, in some cases, slowed to a crawl. Here is what the data tells us.
KEY FINDINGS
- Over the past week, 67 cities (33.5% of the top 200) experienced median upload speed decreases of 10% or greater below range of previous weeks in 2020. Last week, the number was 61, or 30.5%.
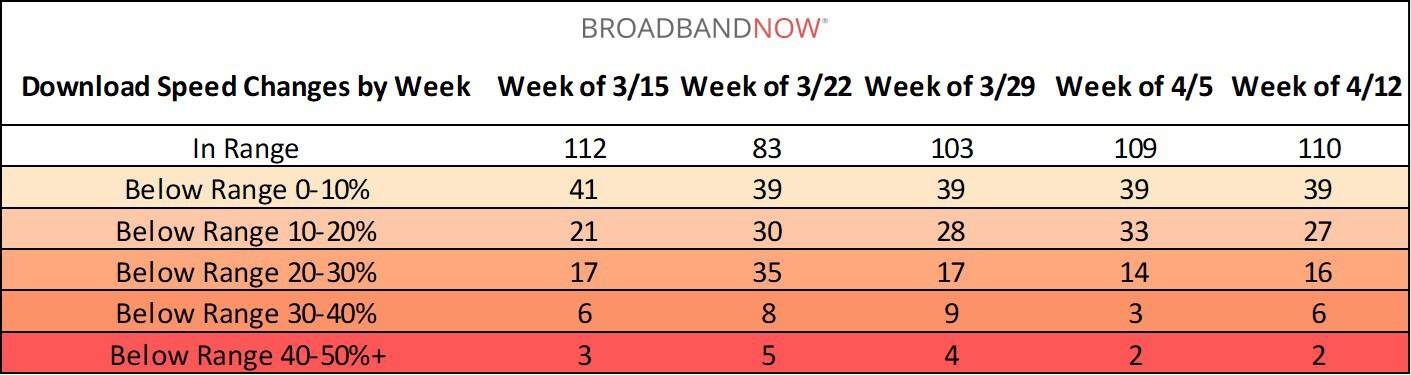
- In turn, 51 cities (25.5%) have recorded download speed dips of 10% or greater, compared to last week’s 52.
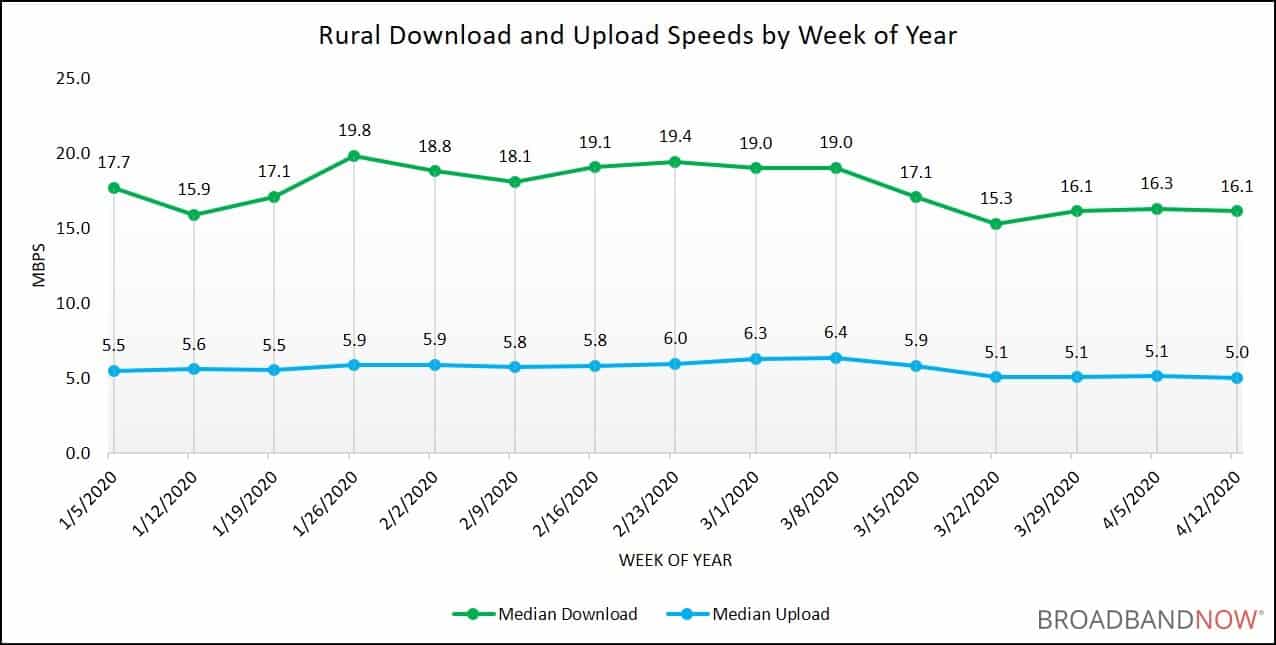
- Median rural download and upload speeds have remained relatively stable for three weeks now, which still sees them measuring lower on average than in previous weeks of 2020.
- Six cities have recorded median upload speed decreases of greater than 40% out of range this week, including Baltimore, Maryland, Jamaica, New York, Oxnard, California, Albuquerque, New Mexico, Boca Raton, Florida, and New Orleans.
- The two cities that experienced significant median download speed decreases of greater than 40% out of range last week are still struggling this week: Evansville, Indiana and Saint Paul, Minnesota.
RURAL UPDATES
Rural communities across the country continue to see statistically minor changes, holding at around 16 Mbps and 5 Mbps median download and upload speeds, respectively. You can view trends over the past 15 calendar weeks in the graph below:
 The data above is collected from aggregated speed test information taken from zip codes in counties marked as non-metropolitan (Micropolitan and Noncore) under the CDC’s Urban–Rural Classification Scheme. Results are displayed in aggregate due to the limited availability of speed test data in rural areas.
MEDIAN INTERNET SPEEDS – 200 MOST POPULOUS U.S. CITIES
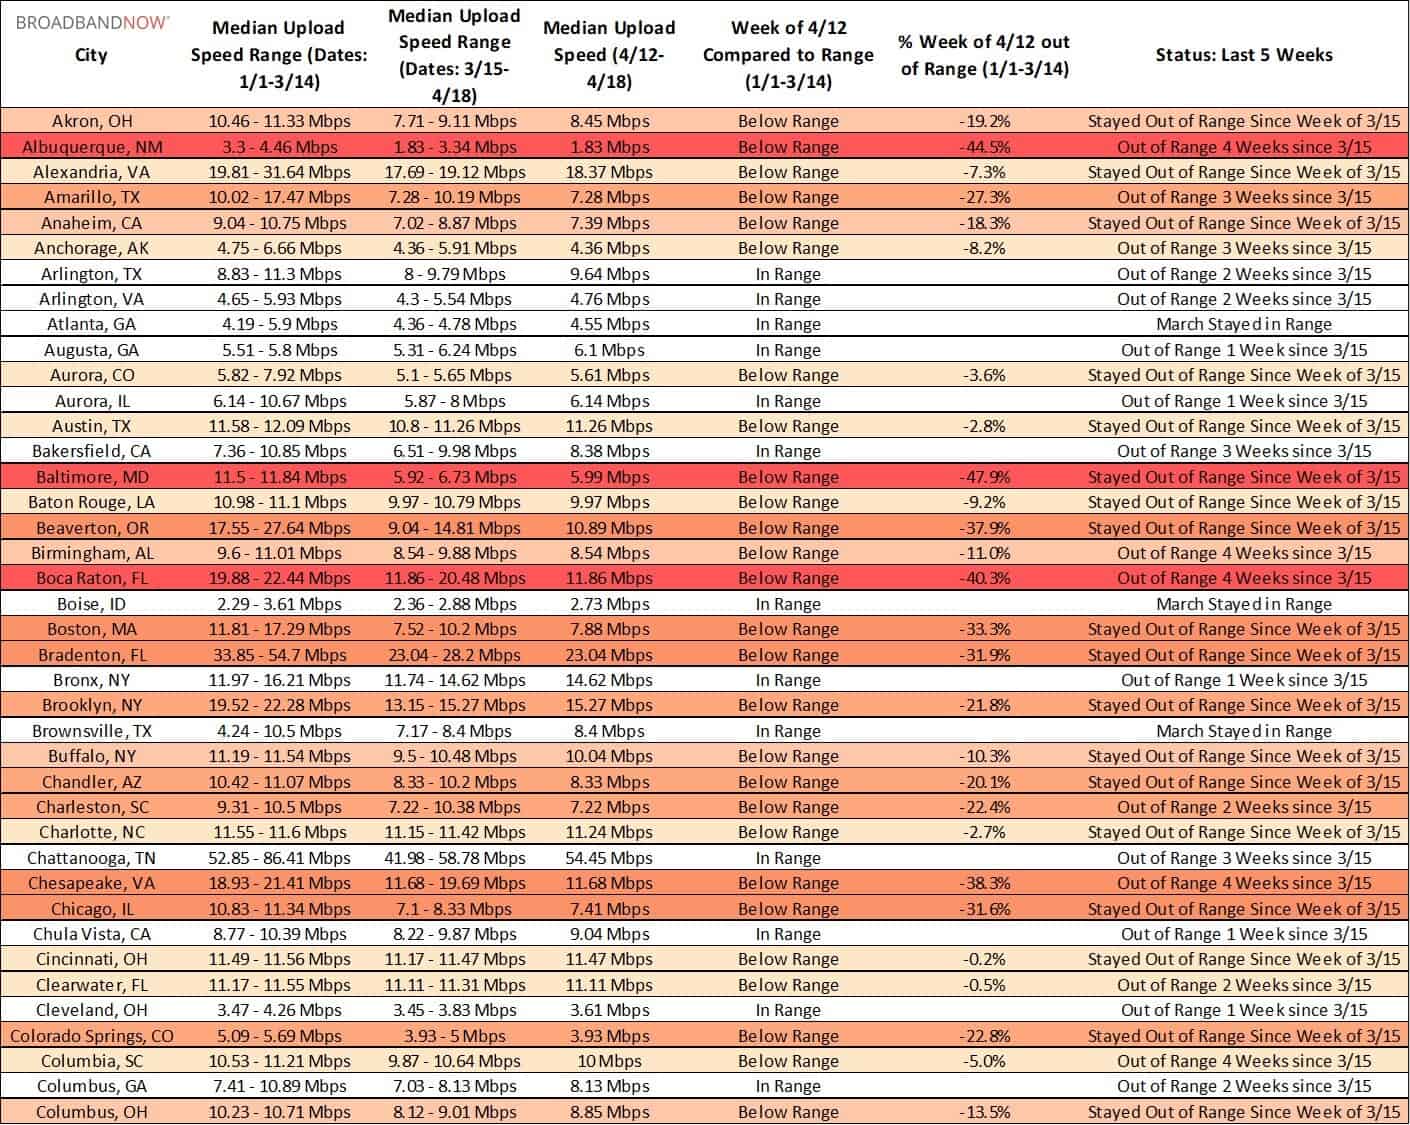
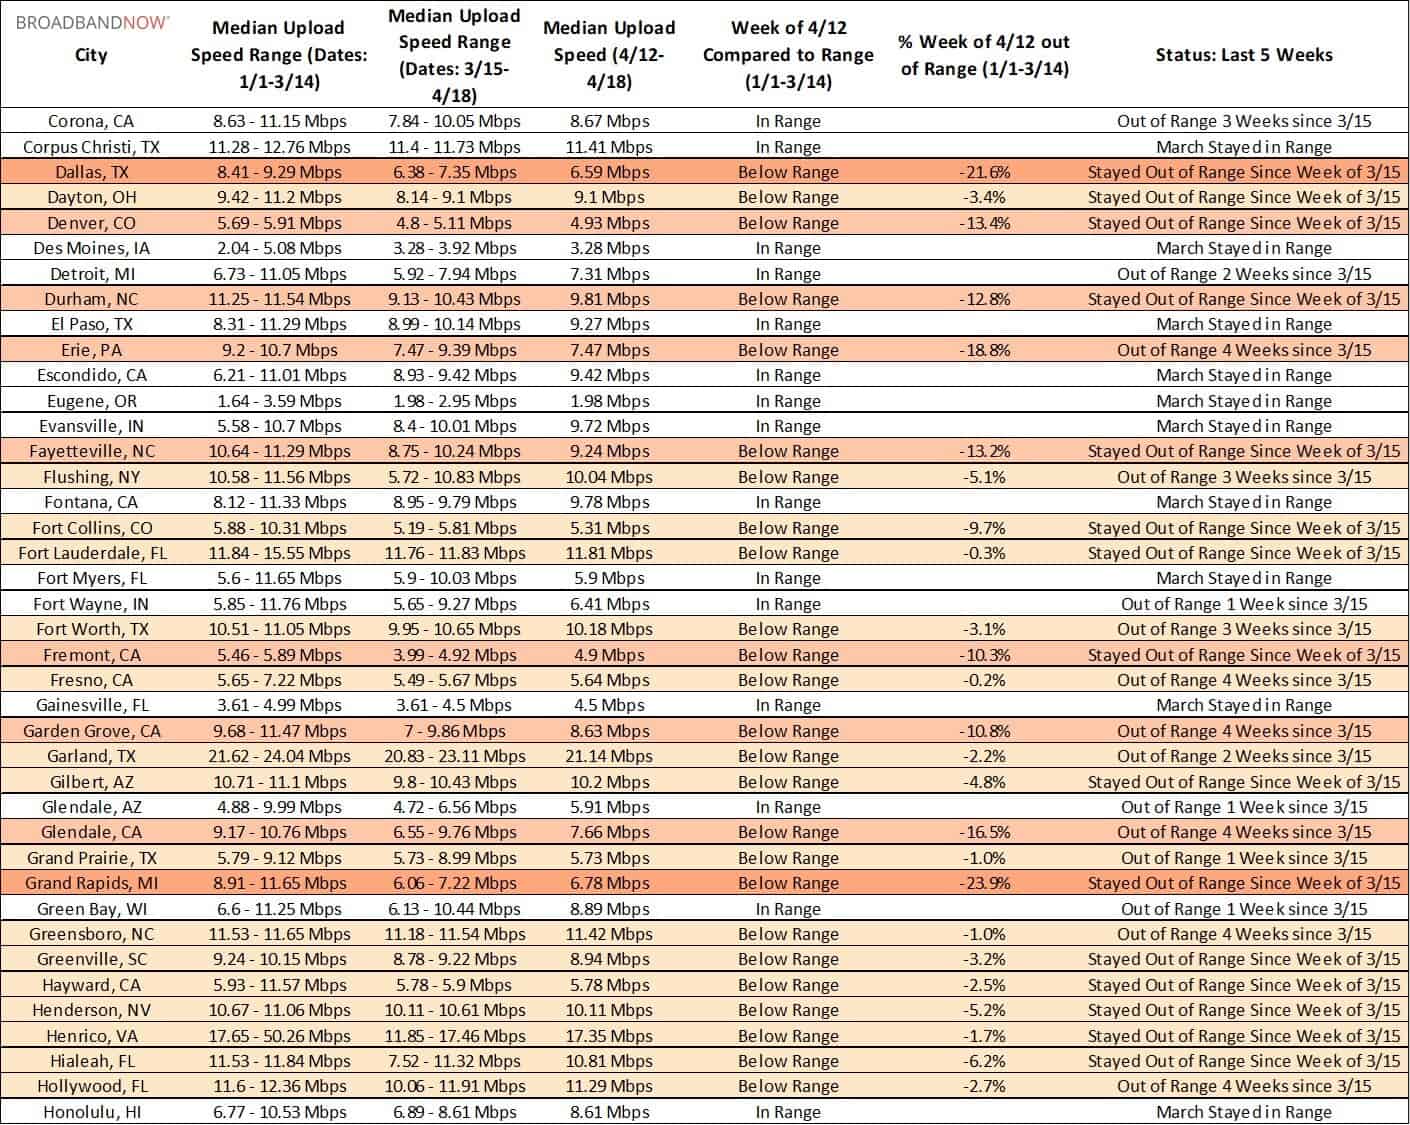
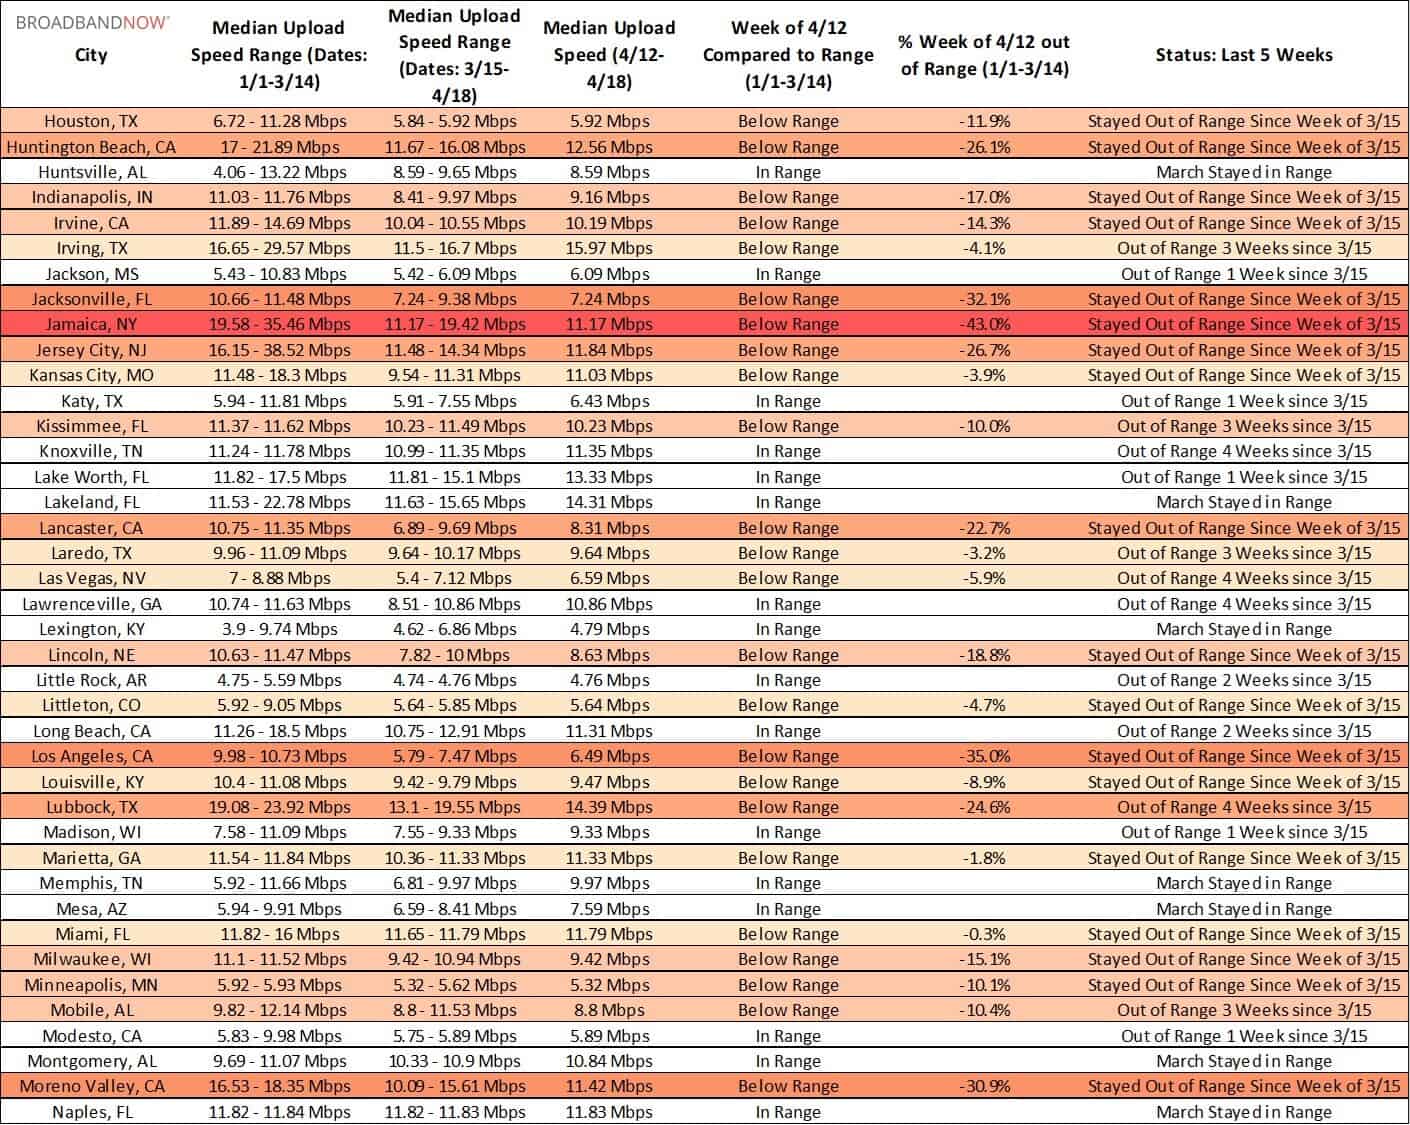
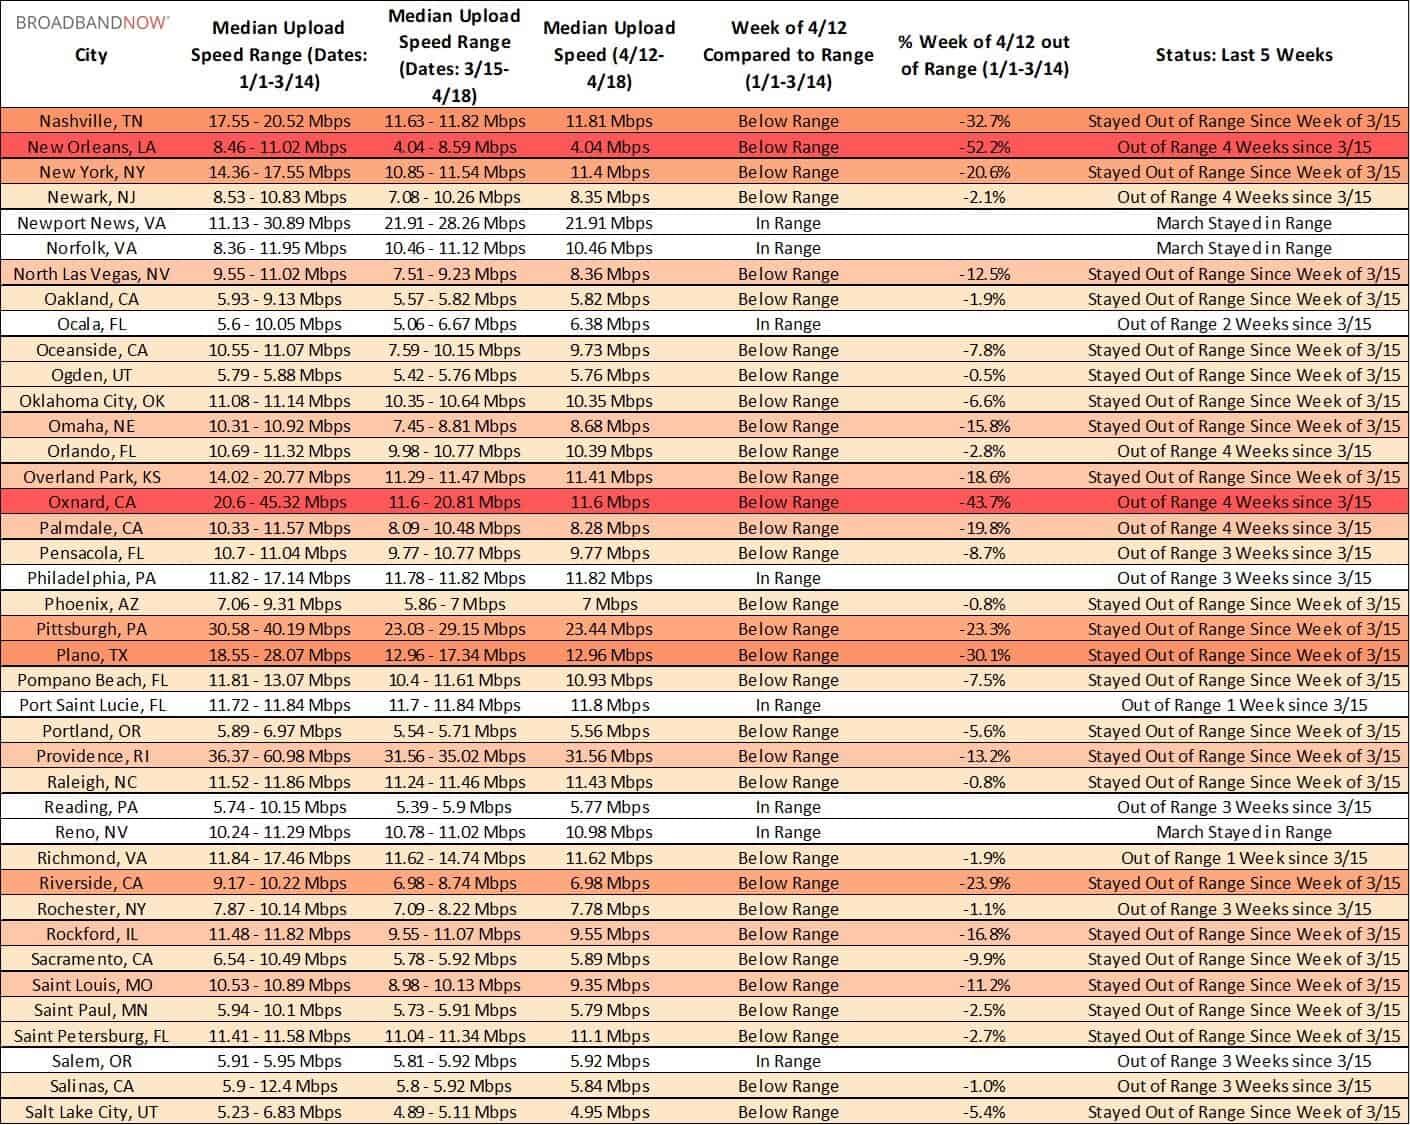
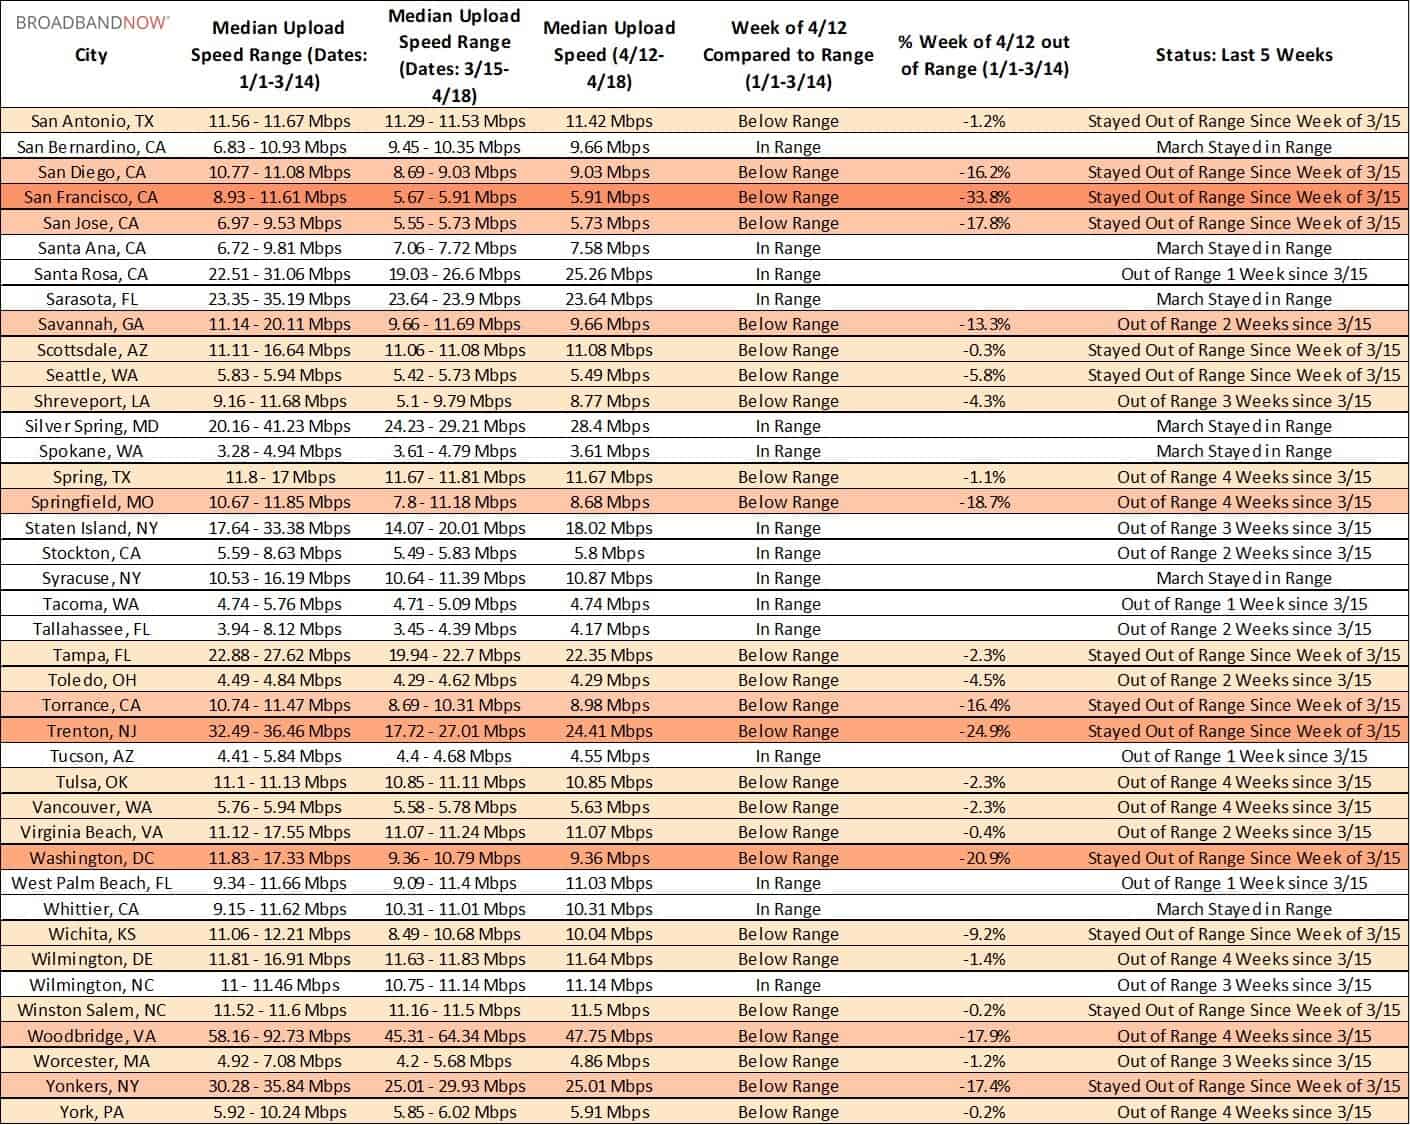
The tables below show both upload and download speed performance over the past five weeks in the 200 most populous cities in the U.S. If a city is “in range,” it means that its current median internet speeds are comparable to the range of speeds recorded over the first 11 weeks in 2020.
While networks across the U.S. have shown signs of recovery for the past several weeks, it would appear that this trend is slowing. Compared to last week, more cities are seeing upload and download speed dips of greater than 20% out of range, and several major metro areas continue to struggle. 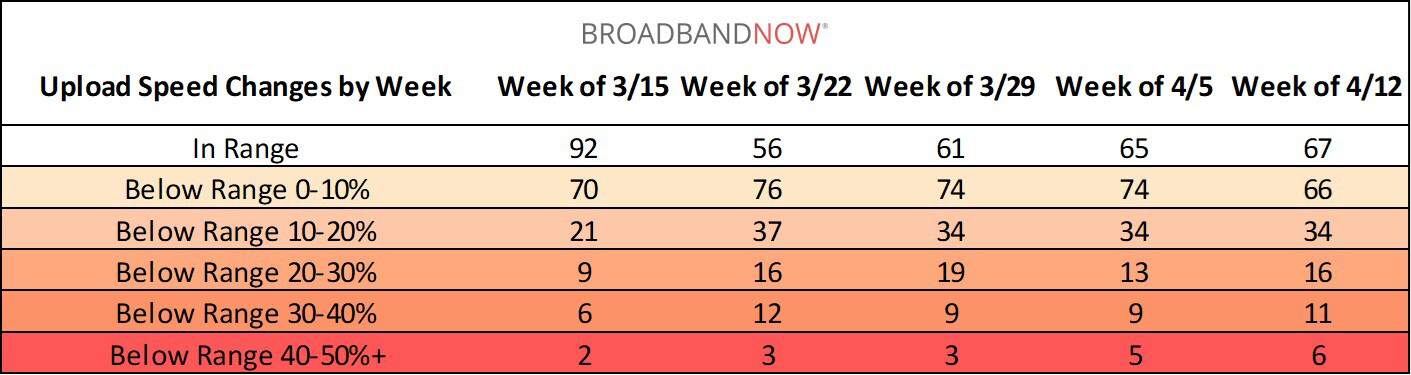
Are you a journalist or researcher writing about this topic?
Contact us and we'll connect you with a broadband market expert on our team who can provide insights and data to support your work.
UPLOAD SPEEDS OVER TIME
The number of cities experiencing stable upload speeds (either in range of previous weeks or below by less than 10%) has decreased to 133, or 66.5% of the top 200 by population. This is down from last week’s report, where the number of cities was 139, or 69.5%.
Cities like Baltimore, Maryland, Oxnard, California, and Jamaica, New York have continued to struggle with upload speed decreases of greater than 40%. This week, they are joined by several new cities experiencing these significant dips, including Albuquerque, New Mexico, Boca Raton, Florida, and New Orleans.
The tables below show upload speeds comparing the past five weeks to the weeks of 1/1 to 3/14 for the top 200 U.S. cities by population, in alphabetical order.
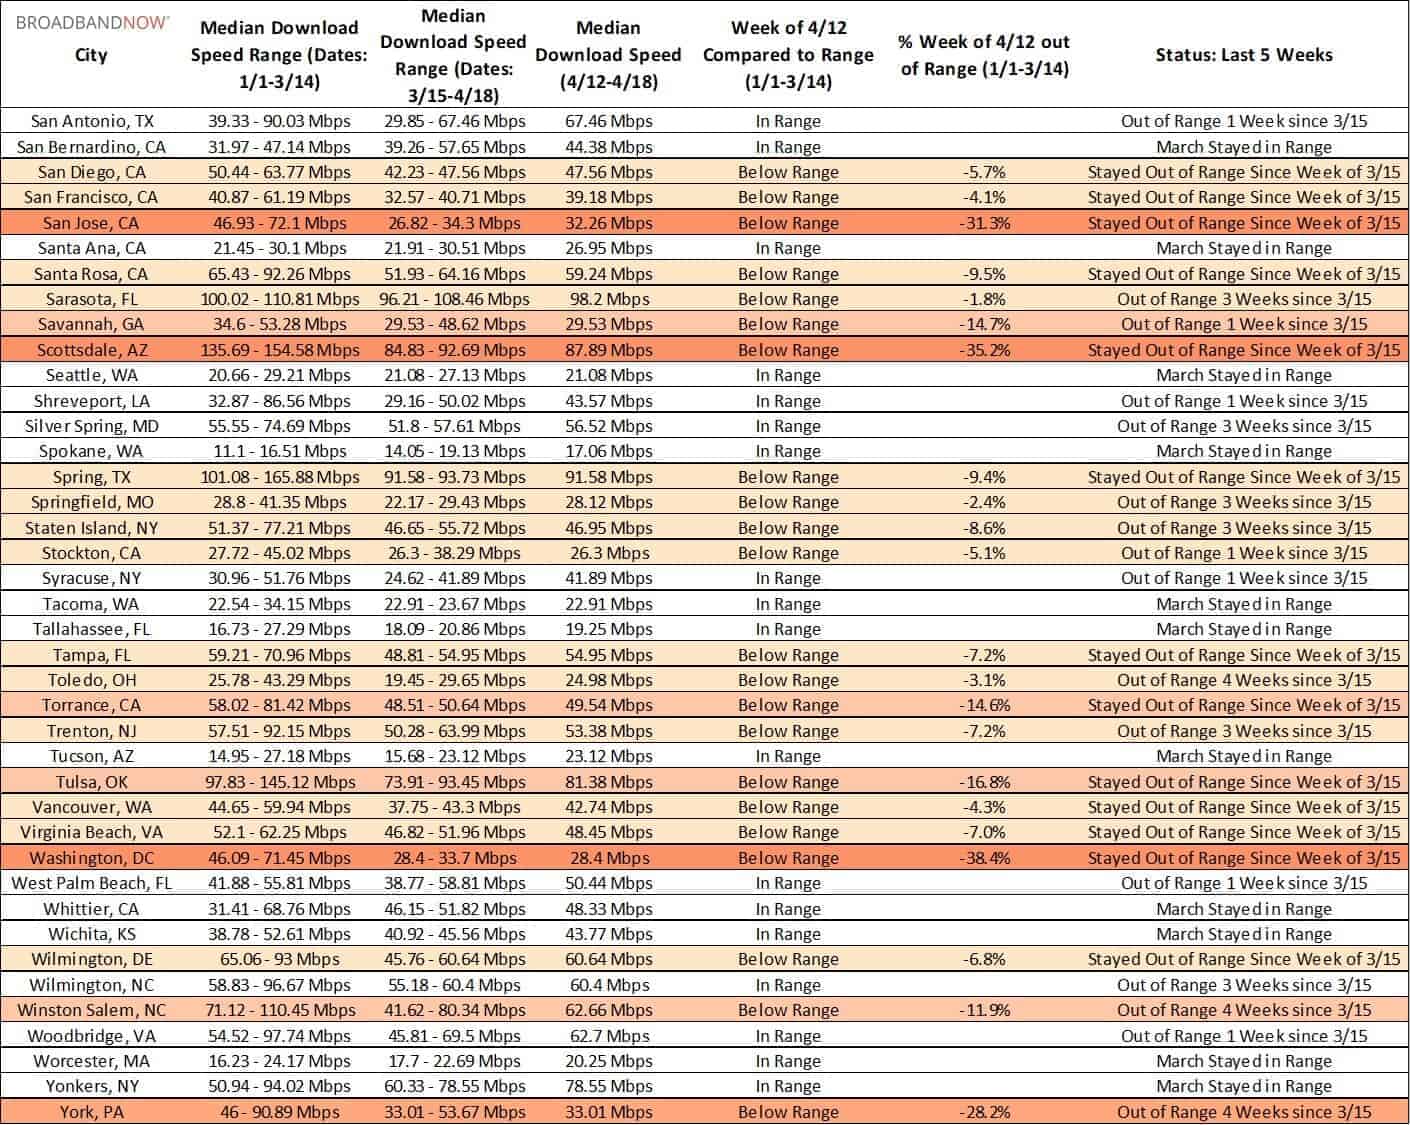
DOWNLOAD SPEEDS OVER TIME
149 cities (74.5%) experienced little disruption in median download speed over the past week, up by half a percent from last week’s 148 cities.
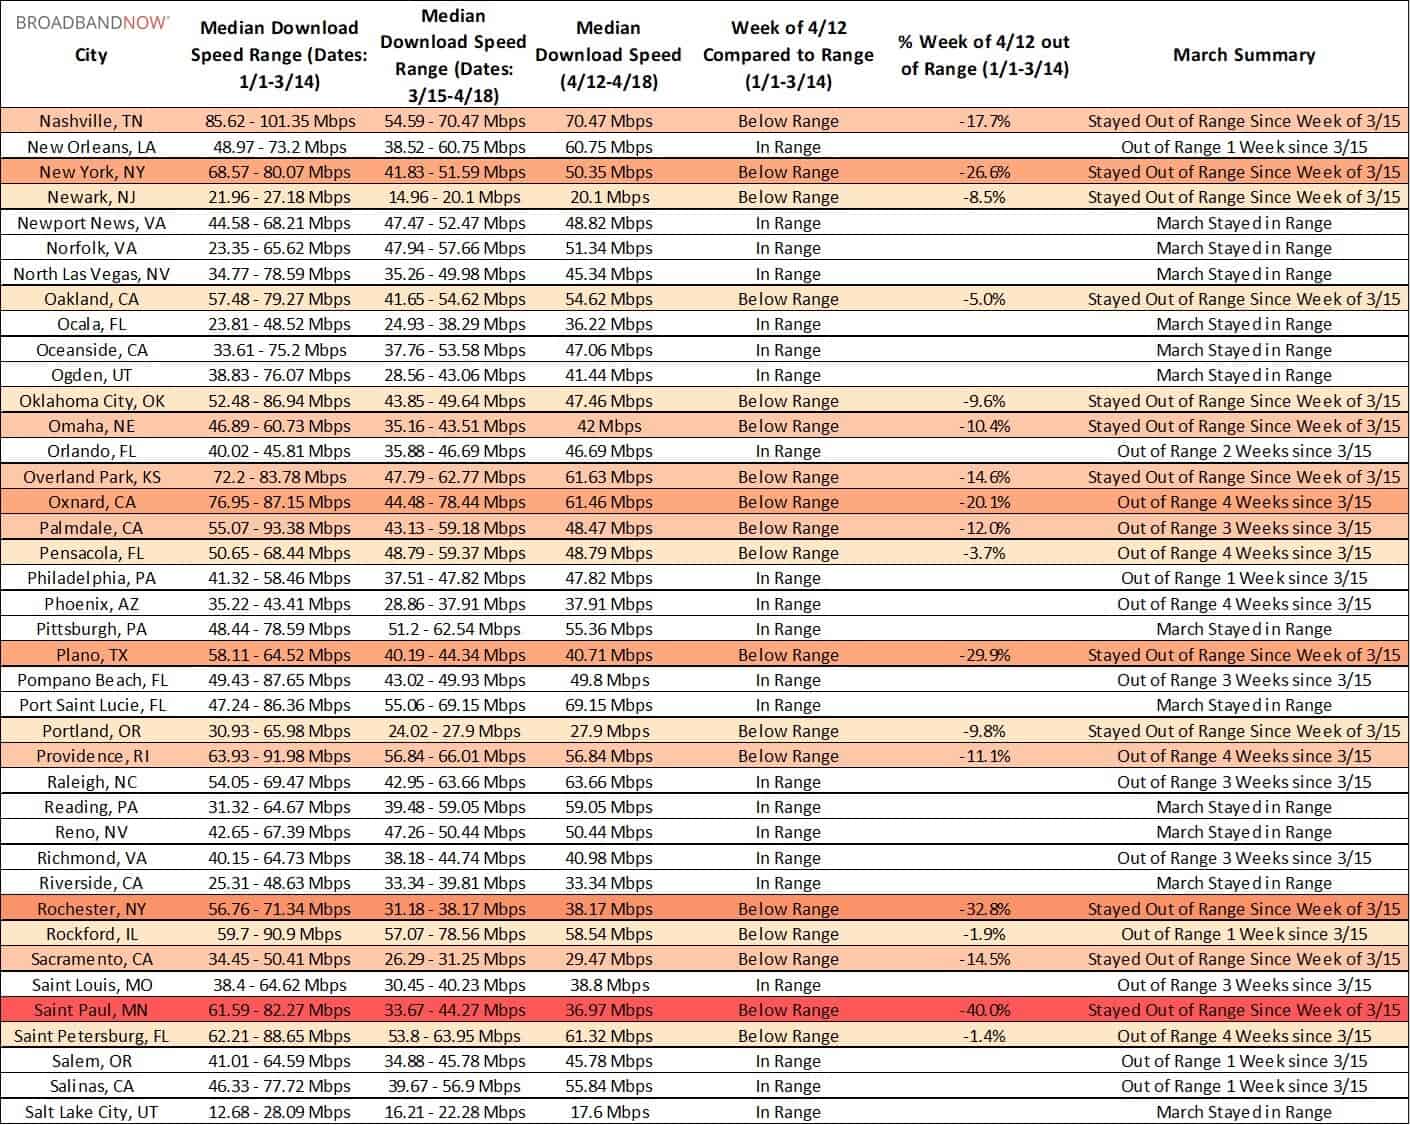
Struggling cities like Evansville, Indiana and Saint Paul, Minnesota are still recording decreases of 40% or greater, though they are the only two to see such significant dips for the second week in a row. That said, cities such as Washington D.C., Erie, Pennsylvania, Littleton, Colorado, Rochester, New York, San Jose, California and Scottsdale, Arizona are all experiencing median speeds that fall 30% of more out of range from previous weeks.
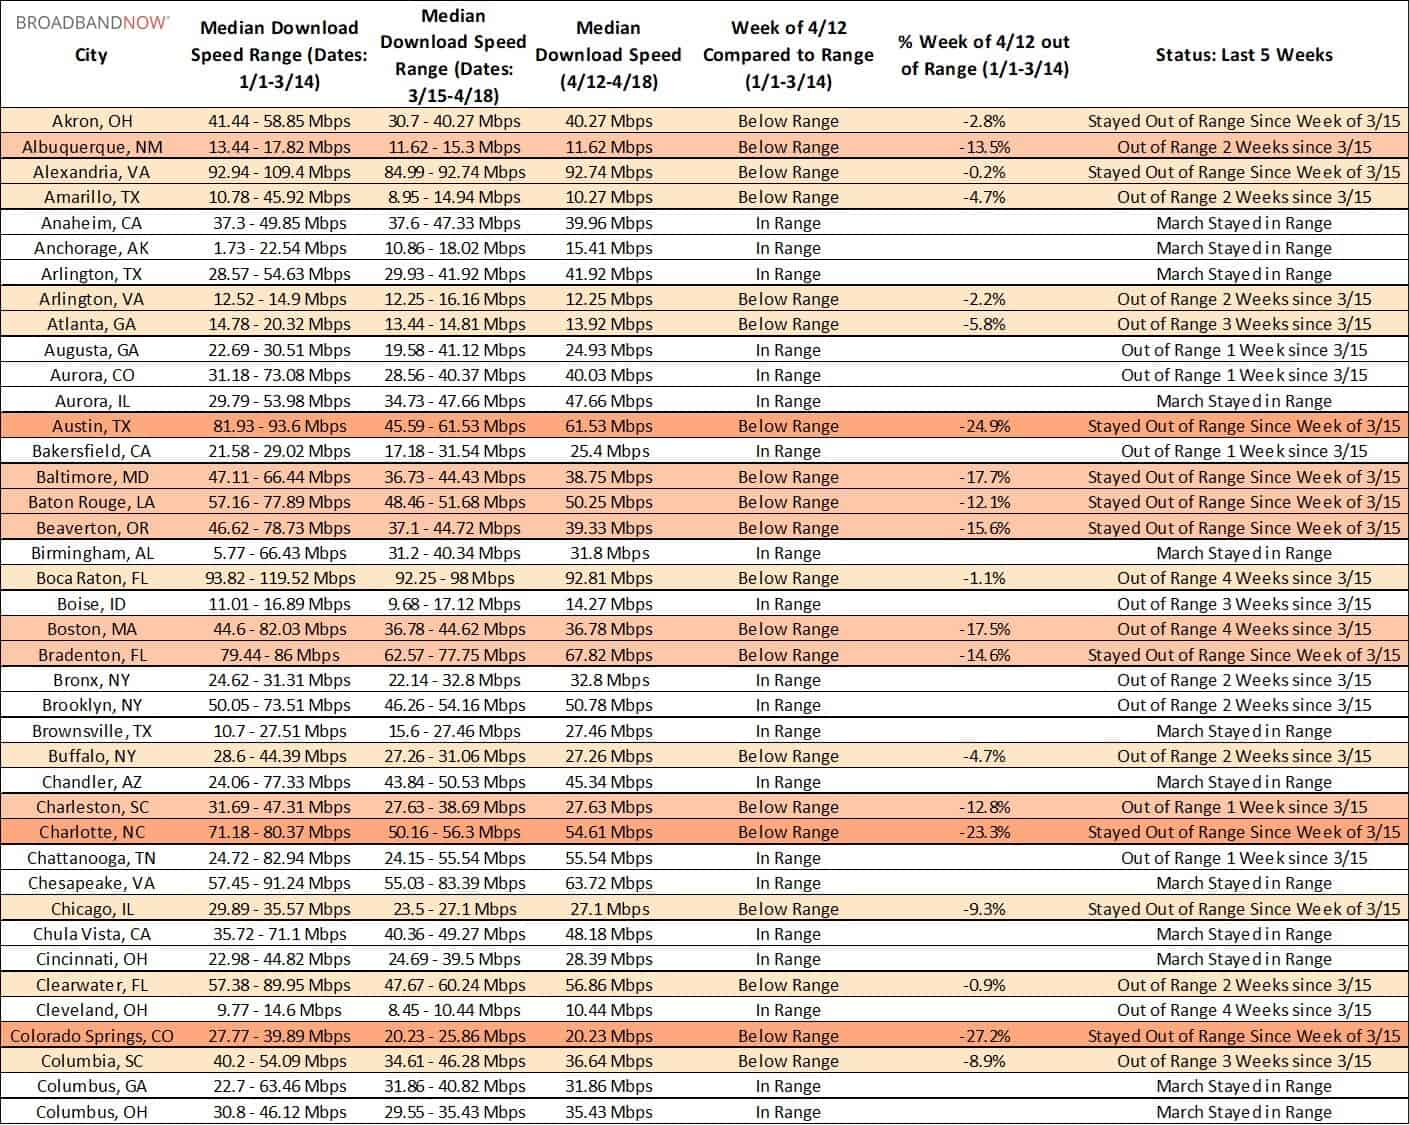
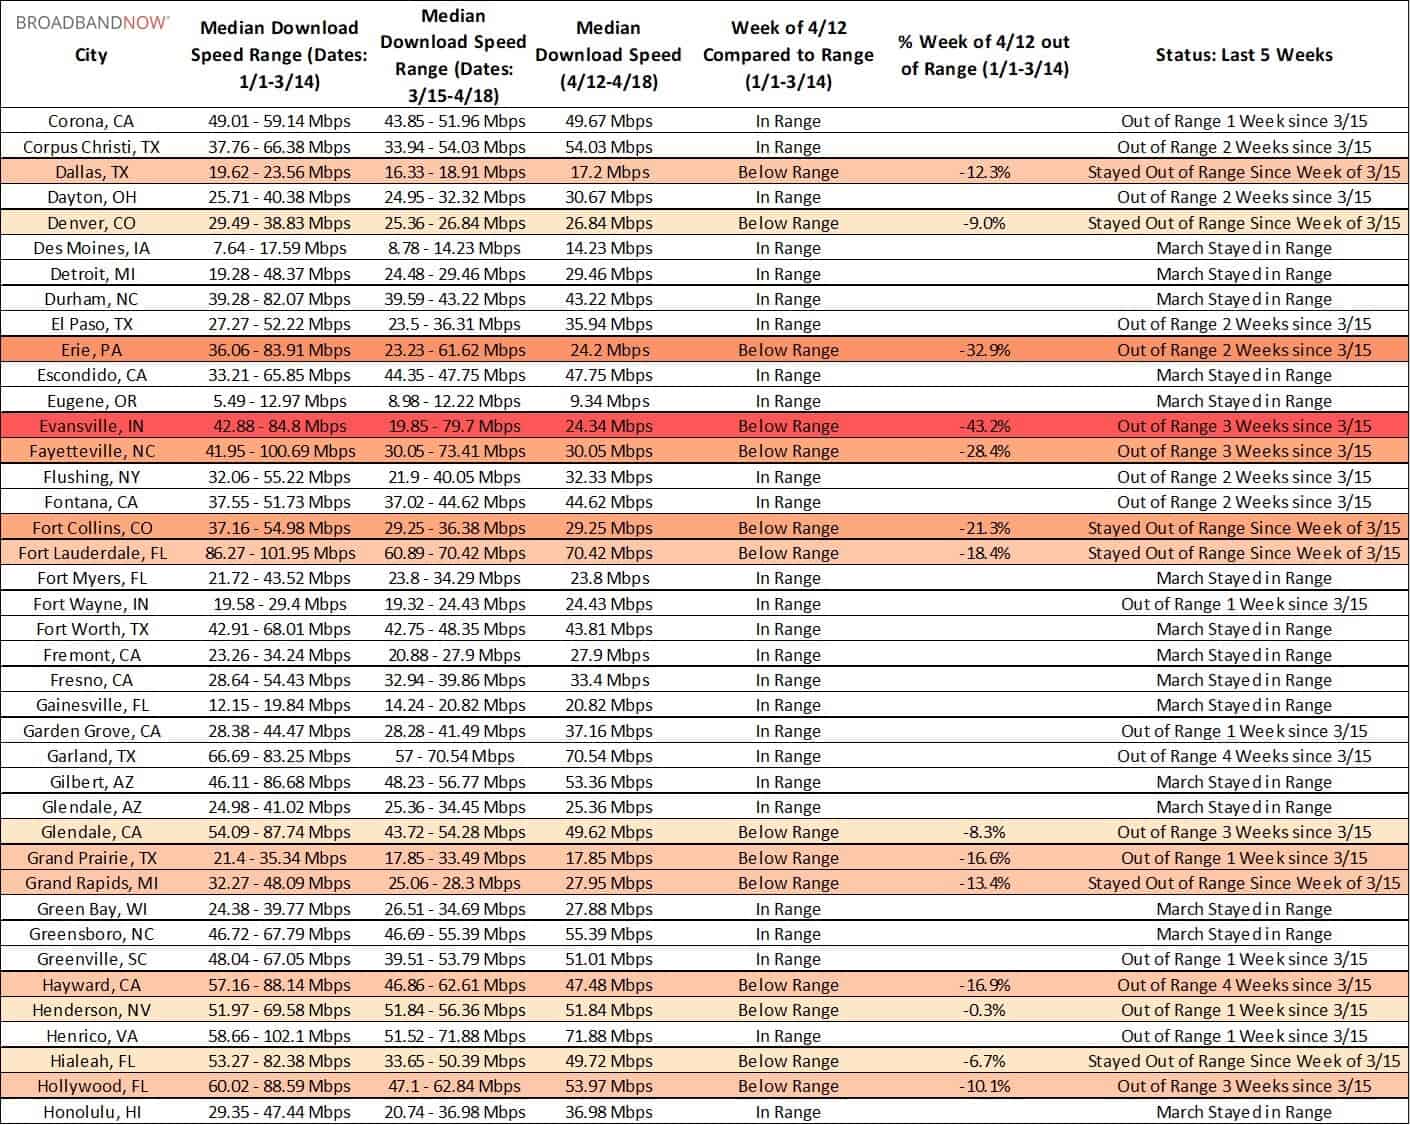
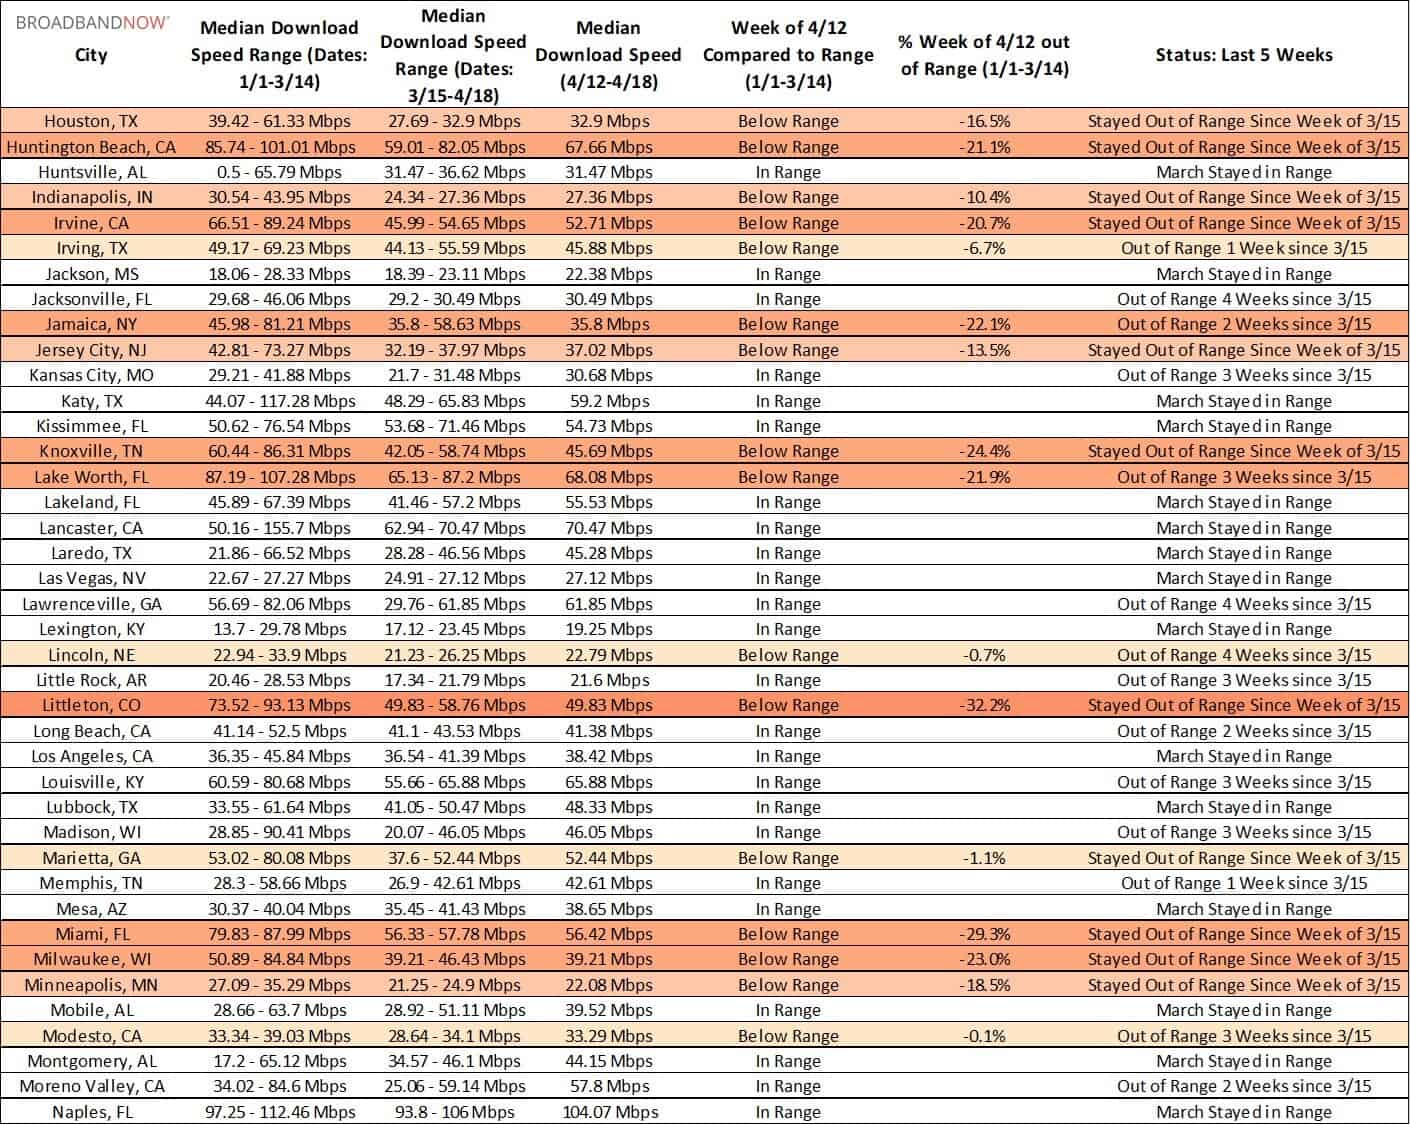
The tables below show download speeds comparing the past five weeks to the weeks of 1/1 to 3/14 for the top 200 U.S. cities by population, in alphabetical order.
Prior Reports
This report is the latest in a series of reports looking into the stability of American internet networks amid the coronavirus pandemic. You can read prior weeks’ reports below:
- Internet Speed Analysis: Top 200 Cities, March 15th – 21st
- Internet Speed Analysis: Rural, Top 200 Cities March 22nd – 28th
- Internet Speed Analysis: Rural, Top 200 Cities March 29th – April 4th
- Internet Speed Analysis: Rural, Top 200 Cities April 5th – 11th
About The Data
We analyzed raw speed test data from M-Lab for the top 200 cities by population in the U.S. in order to determine how well ISP’s are coping with this unprecedented surge in demand. Data was taken from the past 16 calendar weeks, and we calculated median download speeds and ranges for every city listed based on this information.
We also looked at the rural areas as defined by the CDC’s Urban–Rural Classification Scheme as non-metropolitan areas and measured their speeds, in aggregate, by week. The M-Lab’s data we used includes all users running speed tests on various websites, and does not separate by device type or ISP.