Last year, record demand for high-speed internet drove Americans to spend an estimated $118 billion switching internet, phone, and TV providers.
In our third annual consumer shopping study, we found that consumers spent a staggering $118 billion on new home services. (In 2020, our estimate was $91 billion. See also our 2019 study.). As with previous years, our research is based on anonymized shopping data for the millions of users interacting with BroadbandNow supplemented by a broad survey of household decision-makers.
Key Findings:
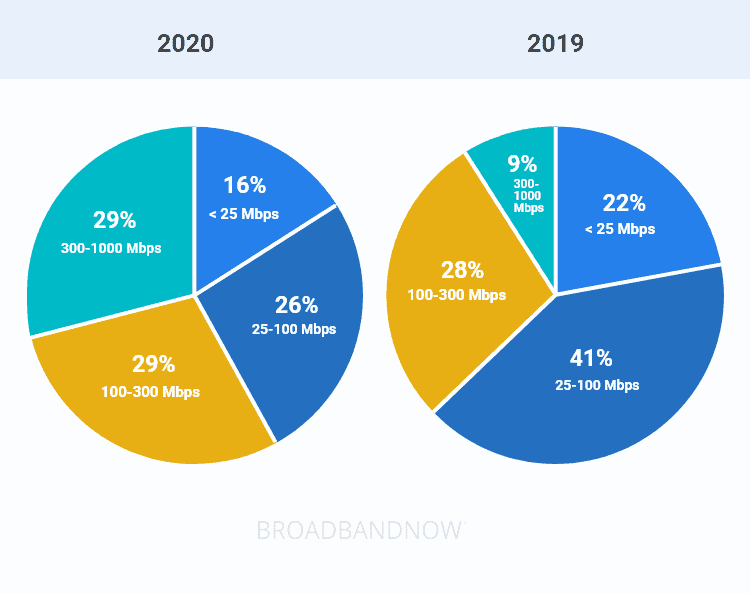
- Nearly 38 million households purchased new internet service in the previous 12 months, an increase of more than 46% year-over-year. This was driven by demand for reliable, high-speed internet at home during COVID and consumer excitement about fiber and other gig-speed plans. BroadbandNow consumer shopping data showed that 29% of new internet purchases were at speeds of 300 Mbps or greater, compared with just 9% in the previous year.
- Consumers also purchased new mobile phone services at record rates, more than doubling compared to the previous year. This is due to aggressive pricing for switching providers, along with new phones.
- Streaming services are arguably in a different category, due to their lower price point. That said, new streaming purchases declined slightly year-over-year. Excitement peaked at the end of 2019 with the release of Disney+ and Apple TV+ and may represent the high water-mark for this type of content.
- Cable/Satellite TV had slightly fewer new purchases year-over-year. This can be explained in part due to a slower moving season in 2020, which drives many new purchases combined with continued momentum for “cord-cutting.”
- Interestingly, we estimate that landline phone purchases increased slightly year-over-year. We believe this is due to consumers wanting ultra-reliable phone service during COVID, and purchasing it as part of a bundle.
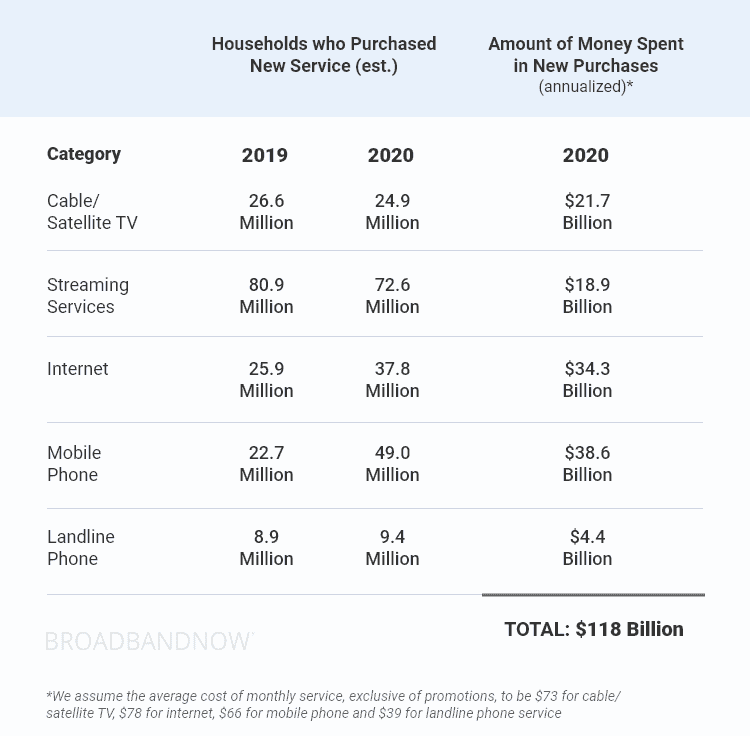
The table below shows our estimates of households that purchased new service in 2019 and 2020, along with the amount spent in new purchases in 2020.
Internet
As a result of more people than ever working, streaming, and gaming at home due to the pandemic, internet service providers experienced record demand for residential internet over the past year. An estimated 38 million U.S. adults shopped for an internet service in 2020, contributing to more than $34 billion in new purchases on an annualized basis.
On the one hand, price point seems to be a major motivator for switching, as evidenced by one-third of our survey respondents saying the reason they switched was for a better price. On the other hand, consumers are clearly interested in faster speeds, which usually come at a higher price point.
The charts below shows the plan speed purchased by more than one million consumers in 2020 compared to 2019.
Higher quality service was another central area of concern for internet service switchers. Nearly one-third of consumers we surveyed cited slow speeds as a chief complaint with their current plan. At the same time, 20% said things like high latency and unreliable service in general frustrated them.
TV
During the last 12 months, nearly 25% of households purchased a new cable or satellite TV package. Overall, in 2020 an estimated $21.72 billion in new TV services was purchased on an annualized basis.
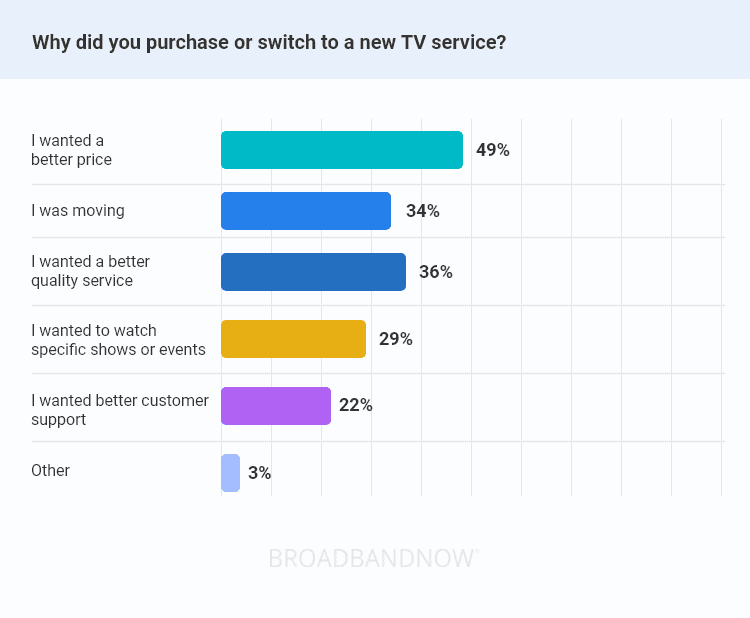
We asked respondents to indicate the primary reasons why they switched their TV service if they did so. The leading cause for switching was the price, followed by those searching for a better quality service.
Why did you purchase or switch to a new TV service?
Bundling internet and cable packages continued to hold value for cost-conscious consumers. Over 78% of shoppers who had cable or satellite TV in 2020 purchased their service as part of a bundle. That was an increase of 18% compared to 2019. One-third of cable or satellite TV customers said bundle package savings is what kept them subscribing versus cutting the cord in favor of streaming.
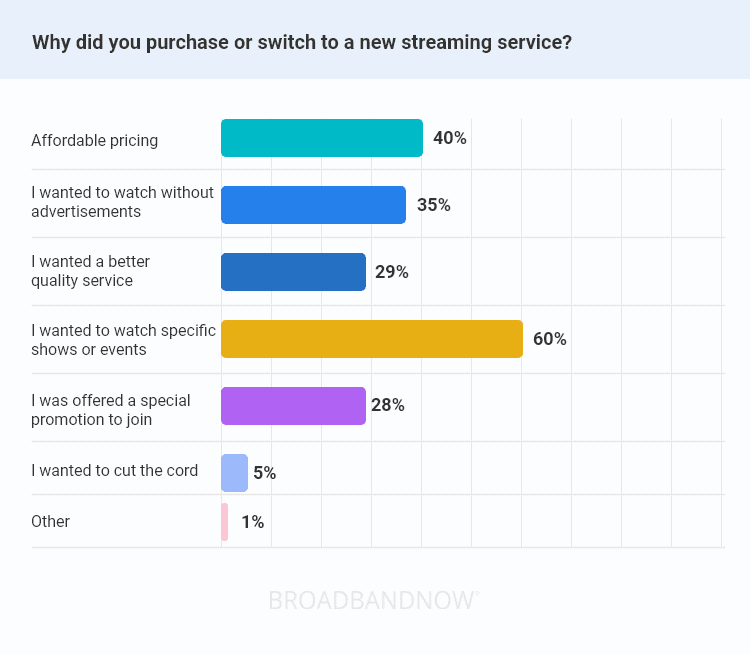
As expected, our research found streaming ownership increased to 91% of households, up 3% compared to 2019. We asked streamers why they were motivated to subscribe to a new service. Watching specific shows was selected by almost 60% of respondents. We anticipate that streaming platforms’ content exclusivity will continue to accelerate this consumer behavior in 2021 and beyond.
Why did you purchase or switch to a new streaming service?
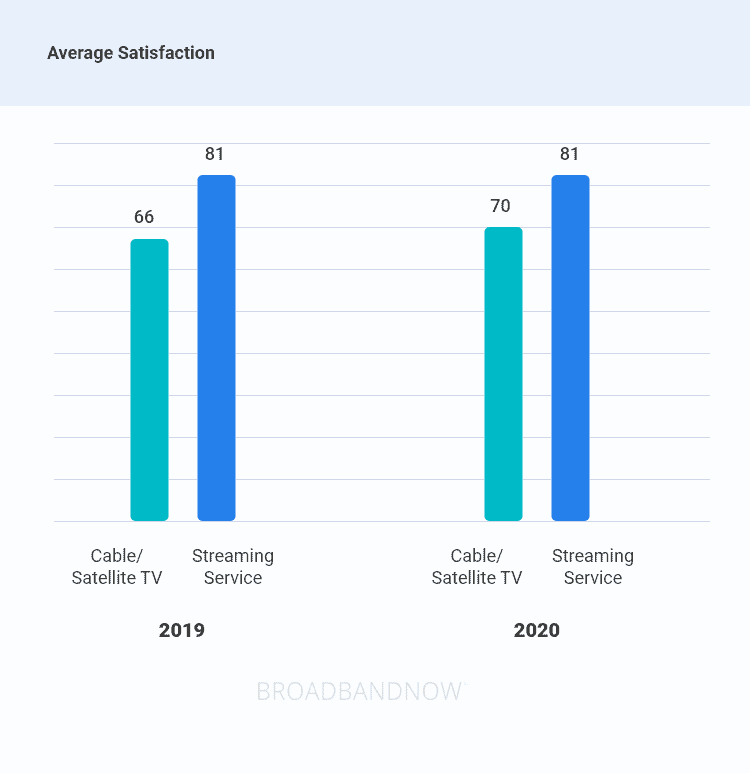
Interestingly, new streaming service shopping was down 13%. We attribute this to the myriad of new service launches in 2019, including Disney+ and Apple TV+, which may have increased new subscriber rates in 2020. However, customers remained happy year over year. Despite the pandemic’s network pressures, recent purchasers of traditional TV services were also slightly more satisfied than previous years.
Phone
Nearly all household decision-makers reported that they currently subscribed to a phone plan in 2020. Almost two-thirds had a mobile service, while 28% had a mobile and landline service, which is up slightly (4%) from last year.
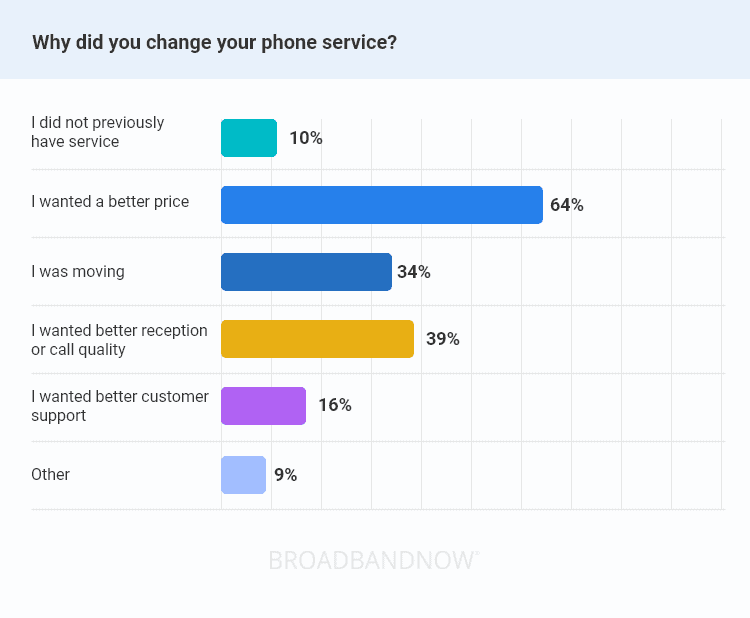
Seventy-eight percent of our survey respondents switched phone services in the last 12 months. Not surprisingly, seeking a better price was the overwhelming response consumers gave when asked why they changed phone services. Beyond cost, a third of shoppers were seeking better call reception or quality.
Why did you change your phone service?
Mobile service purchases in particular increased substantially year over year, with 40% of households shopping for a new plan in the past 12 months compared to only 18% previously. We accredit this to the pandemic-induced demand for more reliable connections to work, play, and connect across all devices.
We found a 7% increase in the number of respondents who took our annual survey on an iPhone or iPad. According to the Pew Research Center, most Americans now own a smartphone – 96%. Therefore, we anticipate mobile purchasing to surpass computer desktop-driven sales in 2021.
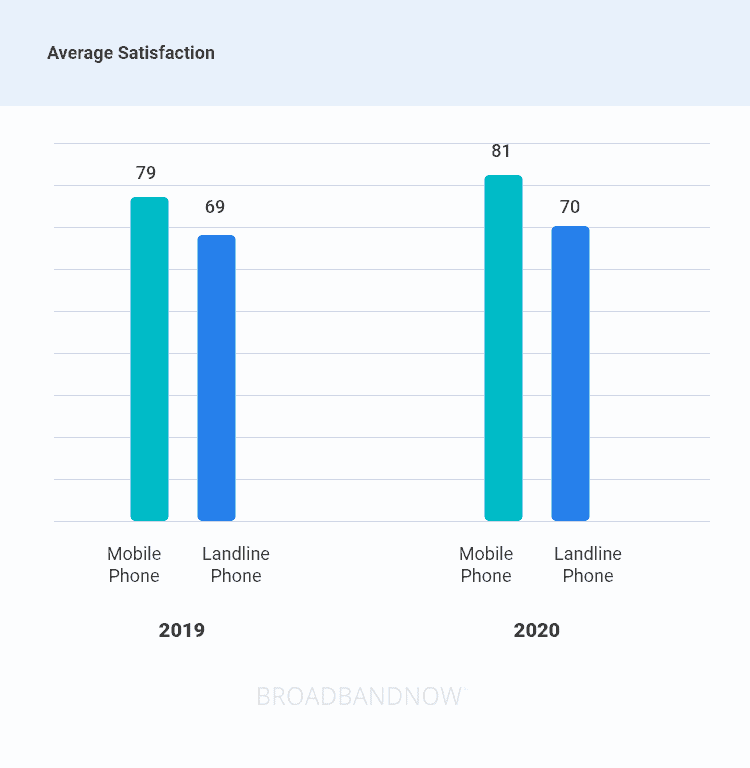
Overall, customers of both mobile phones and landline services were more satisfied than in previous years.
Conclusion
Throughout the rest of 2021 and into next year, we expect there to be high consumer interest in gigabit-speed internet as more Americans work from home, and major providers such as AT&T and Centurylink continue to expand their fiber networks. This may also expand from urban centers like Seattle or Los Angeles into semi-rural and rural areas as the FCC encourages providers to offer better service via government incentives.
As for TV and phone service, we expect a continuation of trends towards cord-cutting and competition based on price or phone upgrades. If you have any questions about our report, please reach out to us and read about our data and methodology below.
About Our Data
Data for the BroadbandNow 2021 U.S. Internet, TV & Phone Shopping Study comes from three sources. First, we used anonymized shopping data from millions of consumers on BroadbandNow.com and additional owned and operated web assets that serve as online resources and consumer guides that millions of Americans use to shop for home services.
Second, we asked thousands of self-identified household decision-makers across the U.S. about their sentiments on their portfolio of home services. This included asking if they had signed up for internet, TV (traditional or streaming), or phone service (landline or wireless) in 2020. Those who answered affirmatively were asked a series of questions to understand why they had purchased and to learn more about their experience. Third, we used anonymized provider sales data from 2020.

Written by