
Internet infrastructure, competition and coverage varies widely across the United States. We’ve collected pricing and speed data on all 2,000 U.S. ISPs, and combined that with publicly available data sets and our own proprietary research on overreporting of internet access to publish this report.
We’ve ranked each state in the United States using a comprehensive formula that takes into account overall levels of access, pricing, and average download speeds (see the full methodology below).
Key Findings
- New Jersey ranks highest overall in the nation with 98% wired broadband coverage and 78% low-priced plan availability.
- Alaska ranks lowest overall, with 61% wired and fixed wireless broadband coverage and no low-priced (wired) plan availability.
- Despite being the 2nd largest state by population, Texas came in 8th overall for broadband availability and pricing. California, the largest state, came in 13th place.
- Affordable wired internet is most widely available in Rhode Island, where 89% of the population has access to a broadband plan $60 or under.
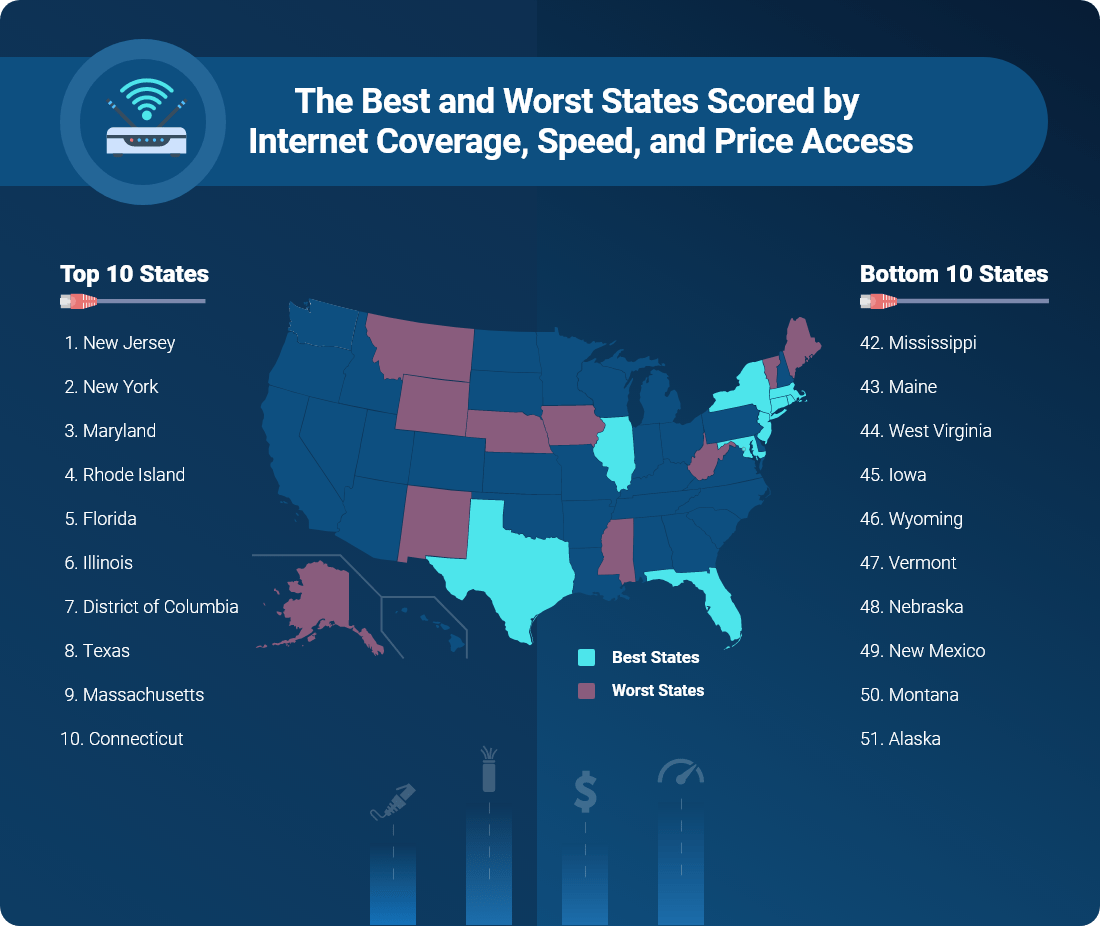
State Rankings
Below, you’ll find each state in the U.S. ranked for the overall strength of its broadband ecosystem.
#1
Delaware
-
Terrestrial Broadband Access:
9,730.0%
-
Wired Low-Priced Plan Access:
4,620.0%
-
Average Speed Test:
-
51
#2
New Hampshire
-
Terrestrial Broadband Access:
9,740.0%
-
Wired Low-Priced Plan Access:
4,580.0%
-
Average Speed Test:
-
73
#3
Maryland
-
Terrestrial Broadband Access:
9,700.0%
-
Wired Low-Priced Plan Access:
3,710.0%
-
Average Speed Test:
-
137
#4
New Jersey
-
Terrestrial Broadband Access:
9,850.0%
-
Wired Low-Priced Plan Access:
2,890.0%
-
Average Speed Test:
-
129
#5
New York
-
Terrestrial Broadband Access:
9,880.0%
-
Wired Low-Priced Plan Access:
3,570.0%
-
Average Speed Test:
-
228
#6
Rhode Island
-
Terrestrial Broadband Access:
9,980.0%
-
Wired Low-Priced Plan Access:
3,720.0%
-
Average Speed Test:
-
37
#7
Connecticut
-
Terrestrial Broadband Access:
9,940.0%
-
Wired Low-Priced Plan Access:
3,210.0%
-
Average Speed Test:
-
78
#8
District of Columbia
-
Terrestrial Broadband Access:
9,950.0%
-
Wired Low-Priced Plan Access:
3,600.0%
-
Average Speed Test:
-
69
#9
Virginia
-
Terrestrial Broadband Access:
9,360.0%
-
Wired Low-Priced Plan Access:
3,330.0%
-
Average Speed Test:
-
210
#10
Washington
-
Terrestrial Broadband Access:
9,670.0%
-
Wired Low-Priced Plan Access:
4,710.0%
-
Average Speed Test:
-
266
#11
Colorado
-
Terrestrial Broadband Access:
9,400.0%
-
Wired Low-Priced Plan Access:
4,580.0%
-
Average Speed Test:
-
273
#12
Pennsylvania
-
Terrestrial Broadband Access:
9,610.0%
-
Wired Low-Priced Plan Access:
3,330.0%
-
Average Speed Test:
-
231
#13
Utah
-
Terrestrial Broadband Access:
9,690.0%
-
Wired Low-Priced Plan Access:
3,500.0%
-
Average Speed Test:
-
156
#14
Illinois
-
Terrestrial Broadband Access:
9,570.0%
-
Wired Low-Priced Plan Access:
3,140.0%
-
Average Speed Test:
-
360
#15
Oregon
-
Terrestrial Broadband Access:
9,480.0%
-
Wired Low-Priced Plan Access:
4,000.0%
-
Average Speed Test:
-
245
#16
Texas
-
Terrestrial Broadband Access:
8,730.0%
-
Wired Low-Priced Plan Access:
3,120.0%
-
Average Speed Test:
-
576
#17
Tennessee
-
Terrestrial Broadband Access:
9,510.0%
-
Wired Low-Priced Plan Access:
3,900.0%
-
Average Speed Test:
-
211
#18
Georgia
-
Terrestrial Broadband Access:
9,520.0%
-
Wired Low-Priced Plan Access:
3,520.0%
-
Average Speed Test:
-
251
#19
California
-
Terrestrial Broadband Access:
9,650.0%
-
Wired Low-Priced Plan Access:
2,920.0%
-
Average Speed Test:
-
410
#20
Florida
-
Terrestrial Broadband Access:
9,750.0%
-
Wired Low-Priced Plan Access:
3,620.0%
-
Average Speed Test:
-
244
#21
Minnesota
-
Terrestrial Broadband Access:
9,560.0%
-
Wired Low-Priced Plan Access:
4,230.0%
-
Average Speed Test:
-
279
#22
South Carolina
-
Terrestrial Broadband Access:
9,430.0%
-
Wired Low-Priced Plan Access:
4,630.0%
-
Average Speed Test:
-
142
#23
Indiana
-
Terrestrial Broadband Access:
9,280.0%
-
Wired Low-Priced Plan Access:
3,140.0%
-
Average Speed Test:
-
269
#24
Alabama
-
Terrestrial Broadband Access:
8,980.0%
-
Wired Low-Priced Plan Access:
4,630.0%
-
Average Speed Test:
-
166
#25
Iowa
-
Terrestrial Broadband Access:
9,480.0%
-
Wired Low-Priced Plan Access:
3,330.0%
-
Average Speed Test:
-
458
#26
North Dakota
-
Terrestrial Broadband Access:
9,720.0%
-
Wired Low-Priced Plan Access:
2,500.0%
-
Average Speed Test:
-
101
#27
Michigan
-
Terrestrial Broadband Access:
9,350.0%
-
Wired Low-Priced Plan Access:
3,510.0%
-
Average Speed Test:
-
271
#28
Wisconsin
-
Terrestrial Broadband Access:
9,350.0%
-
Wired Low-Priced Plan Access:
3,120.0%
-
Average Speed Test:
-
245
#29
North Carolina
-
Terrestrial Broadband Access:
9,410.0%
-
Wired Low-Priced Plan Access:
2,800.0%
-
Average Speed Test:
-
205
#30
South Dakota
-
Terrestrial Broadband Access:
9,550.0%
-
Wired Low-Priced Plan Access:
2,000.0%
-
Average Speed Test:
-
128
#31
Vermont
-
Terrestrial Broadband Access:
9,460.0%
-
Wired Low-Priced Plan Access:
3,500.0%
-
Average Speed Test:
-
72
#32
Maine
-
Terrestrial Broadband Access:
9,720.0%
-
Wired Low-Priced Plan Access:
4,580.0%
-
Average Speed Test:
-
77
#33
Nebraska
-
Terrestrial Broadband Access:
9,300.0%
-
Wired Low-Priced Plan Access:
3,610.0%
-
Average Speed Test:
-
191
#34
Nevada
-
Terrestrial Broadband Access:
9,480.0%
-
Wired Low-Priced Plan Access:
1,860.0%
-
Average Speed Test:
-
143
#35
Wyoming
-
Terrestrial Broadband Access:
8,440.0%
-
Wired Low-Priced Plan Access:
5,560.0%
-
Average Speed Test:
-
97
#36
Kentucky
-
Terrestrial Broadband Access:
9,370.0%
-
Wired Low-Priced Plan Access:
2,500.0%
-
Average Speed Test:
-
200
#37
Oklahoma
-
Terrestrial Broadband Access:
8,280.0%
-
Wired Low-Priced Plan Access:
2,550.0%
-
Average Speed Test:
-
226
#38
Ohio
-
Terrestrial Broadband Access:
9,580.0%
-
Wired Low-Priced Plan Access:
3,030.0%
-
Average Speed Test:
-
288
#39
New Mexico
-
Terrestrial Broadband Access:
8,880.0%
-
Wired Low-Priced Plan Access:
2,730.0%
-
Average Speed Test:
-
153
#40
Idaho
-
Terrestrial Broadband Access:
8,390.0%
-
Wired Low-Priced Plan Access:
3,440.0%
-
Average Speed Test:
-
167
#41
Arizona
-
Terrestrial Broadband Access:
9,050.0%
-
Wired Low-Priced Plan Access:
2,600.0%
-
Average Speed Test:
-
199
#42
Hawaii
-
Terrestrial Broadband Access:
9,780.0%
-
Wired Low-Priced Plan Access:
2,000.0%
-
Average Speed Test:
-
45
#43
Missouri
-
Terrestrial Broadband Access:
8,690.0%
-
Wired Low-Priced Plan Access:
2,180.0%
-
Average Speed Test:
-
291
#44
Montana
-
Terrestrial Broadband Access:
8,420.0%
-
Wired Low-Priced Plan Access:
4,170.0%
-
Average Speed Test:
-
131
#45
Mississippi
-
Terrestrial Broadband Access:
8,000.0%
-
Wired Low-Priced Plan Access:
3,110.0%
-
Average Speed Test:
-
130
#46
Louisiana
-
Terrestrial Broadband Access:
8,210.0%
-
Wired Low-Priced Plan Access:
2,900.0%
-
Average Speed Test:
-
138
#47
Massachusetts
-
Terrestrial Broadband Access:
9,830.0%
-
Wired Low-Priced Plan Access:
2,820.0%
-
Average Speed Test:
-
108
#48
Kansas
-
Terrestrial Broadband Access:
9,150.0%
-
Wired Low-Priced Plan Access:
2,840.0%
-
Average Speed Test:
-
232
#49
Arkansas
-
Terrestrial Broadband Access:
7,750.0%
-
Wired Low-Priced Plan Access:
2,900.0%
-
Average Speed Test:
-
174
#50
West Virginia
-
Terrestrial Broadband Access:
6,580.0%
-
Wired Low-Priced Plan Access:
3,020.0%
-
Average Speed Test:
-
101
#51
Alaska
-
Terrestrial Broadband Access:
8,660.0%
-
Wired Low-Priced Plan Access:
2,000.0%
-
Average Speed Test:
-
78
How States Can Improve Their Broadband Coverage
We are frequently asked what states can do to accelerate access to robust internet services. Below are the two most effective ways we have seen state and local governments improve the broadband situation in their areas:
Create better mapping and adopt smarter funding strategies
Currently, issues of overreporting make it more difficult for states to accurately measure any progress they are making. If broadband availability mapping was measurably improved, it could help local and state governments better plan initiatives and funding around the areas that need the most help.
Promote and encourage community broadband solutions in low-competition areas
Hundreds of cities across the U.S. have already established municipal broadband networks, which can provide residents with robust, affordable broadband, especially in rural areas where private competition can be low. Removing barriers to establishing these networks fosters competition and improves broadband availability and affordability for everyone.
Methodology
Coverage Data
For our metric “Terrestrial Broadband Coverage” which includes both wired and fixed wireless technologies, we relied on the coverage estimates we calculated from our study “FCC Reports Broadband Unavailable to 21.3 Million Americans, BroadbandNow Study Indicates 42 Million Do Not Have Access”.
For our other state level coverage rankings we calculated coverage at the census block level, similar to how our quarterly reports are calculated. Since each census block is also tied to its parent state, we have aggregated coverage directly from the block to the state level.
Pricing Data
If broadband internet service was available in a given census block, we calculated the minimum price available to that block. This “minimum available price” was determined by finding the lowest cost price for standalone internet plans offered by a given provider. Both national and regional plans were considered.
Additionally, regional plans were tagged to individual zip codes. In the event that a census block was within a zip that matched the regional plan’s coverage, it was considered to have that plan available. We utilized standard, non-promotional monthly prices, only considering the promotional prices if there was no monthly price publicly available.
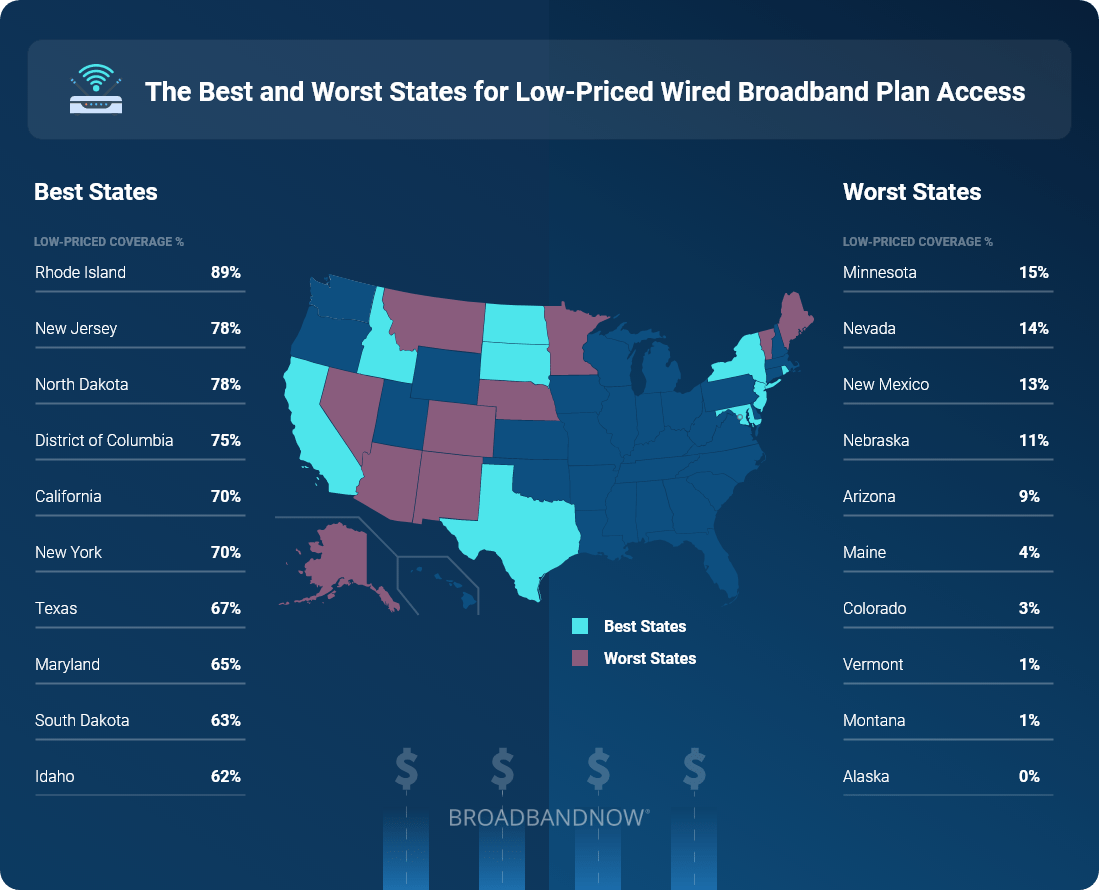
Our threshold for “low-priced plan” was established by using the 20th percentile of all currently available standalone internet plans, which was $59.95 (rounded to $60). If the minimum priced plan available to a block was $60 or less, we counted that block’s population as having access.
Speed Test Data
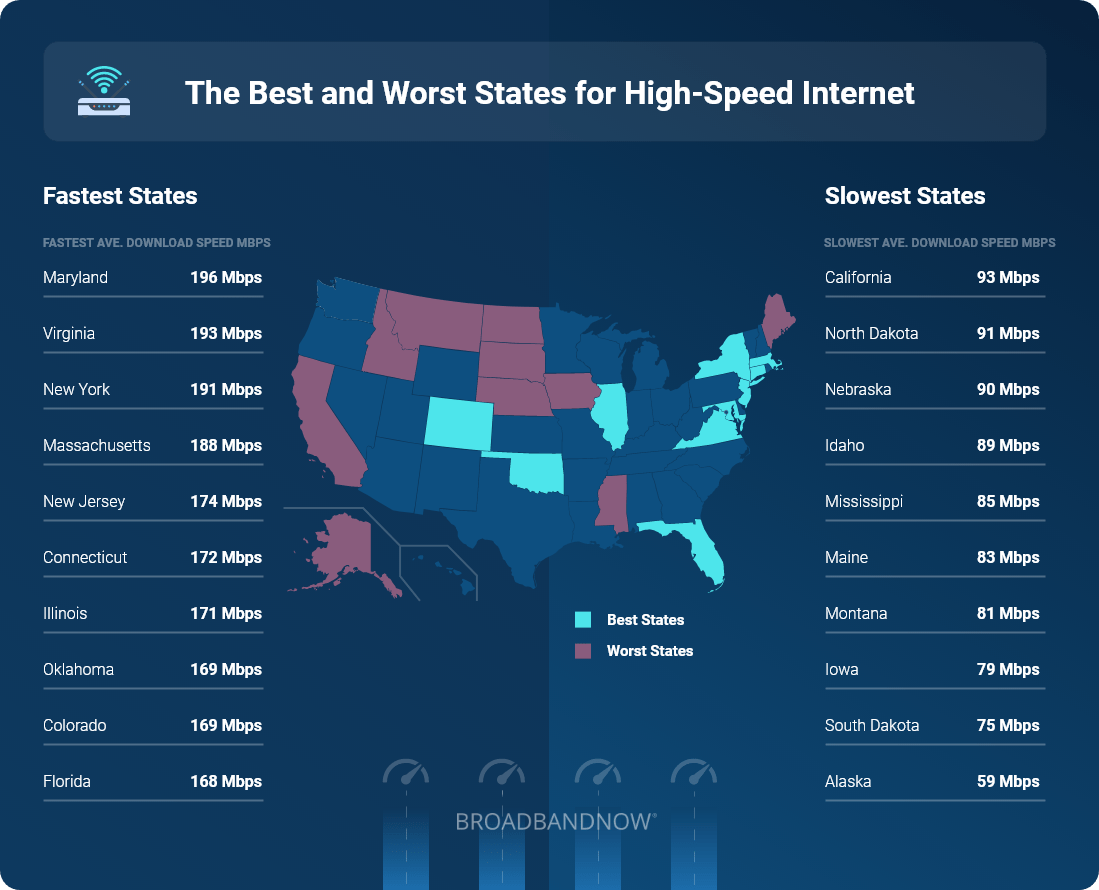
For speed tests, our rankings utilized the “fastest average speed” data from MLabs, which represents the average of all the tests that fell into the 90th percentile of speeds.
State Rankings
To rank the states, we organized cities in them from best to worst in each of the following metrics: access to broadband (including satellite), access to terrestrial broadband, access to low-priced wired broadband plans and average MLabs download speed. Each of these was pulled from a mixture of public and private data sources, including the FCC’s Form 477 deployment reports and our own internal provider database.
Scoring
To score each state, we used the following weighted blend of data:
- 30% Terrestrial Broadband Access Rank
- 30% Wired Low-Priced Plan Access Rank
- 30% Speed Test Rank
- 5% Broadband Access Rank (includes non-wired)
- 5% Low-Priced Plan Access Rank (includes non-wired)
About the Data
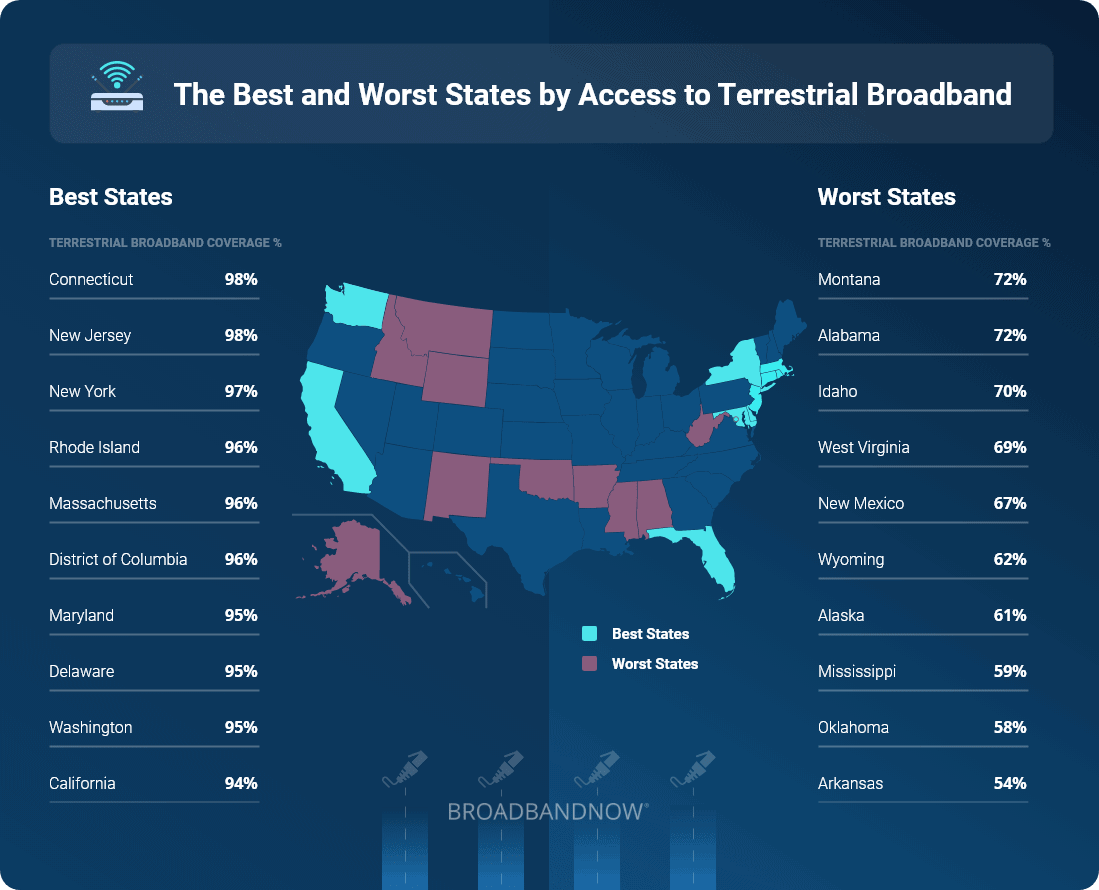
Terrestrial Broadband Coverage %: The percent of a given state’s population that we estimate to have access to wired (DSL, Copper, Cable, Fiber) or fixed wireless internet of at least 25 Mbps download and 3 Mbps upload. Coverage was estimated for our our study “FCC Reports Broadband Unavailable to 21.3 Million Americans, BroadbandNow Study Indicates 42 Million Do Not Have Access” where we manually checking over 11 thousand addresses randomly selected across the United States to test if the FCC’s coverage of their location was accurate or not.
Broadband Coverage %: The percent of a given state’s population that has access to an internet connection of any technology of at least 25 Mbps download and 3 Mbps upload. Coverage is calculated at the census block level and aggregated.
Fastest Average Speed: The average of all speed test results that were in the top 90th percentile in a given state. These tests reflect download speed alone, and are the result of a 12-month rolling average.
Low-Priced Plan Coverage % (Wired Broadband): The percent of the state’s population that has access to wired (DSL, Copper, Cable, Fiber) of at least 25 Mbps download and 3 Mbps upload AND a standalone internet broadband speed plan that is $60 or less per month (regular monthly price). Coverage is calculated at the census block level and aggregated.
Low-Priced Plan Coverage % (Broadband): The percent of the state’s population that has access to an internet connection of any technology of at least 25 Mbps download and 3 Mbps upload AND a standalone internet broadband speed plan that is $60 or less per month (regular monthly price). Coverage is calculated at the census block level and aggregated.

Written by